Ever since being diagnosed seven years ago, I have been keen to participate in trials of new treatments. Unfortunately, there are not a lot of trials for LADAs (at least, not in Australia). When I became insulin dependent, a couple of years ago, I thought things would change but either my age (I am 50) or my HbA1c excludes me (studies generally like higher HbA1cs and mine is too low). I do check for new studies every month or so and thought putting a list together of where people can go may be useful.
ANZCTR search results | Australian Clinical Trials is an Australian Federal Government registry for many health conditions with filters to show only ones relating to diabetes. Despite the title it seemed to only show trials in Australia at the time of writing.
Baker Heart and Diabetes Institute Clinical Research Trials
Clinical research trials (baker.edu.au) covers all types of diabetes (or, at least, types 1 and 2). The Baker is based in Melbourne but my understanding is some of their trials do recruit outside of Melbourne.
Disclosure: I am a voluntary clinical affiliate with The Baker (basically I am on the books if they need Lived Experience input on a trial) and an Associate Investigator on their FAME-1 Eye trial.
Australasian Type 1 Diabetes Immunotherapy Collective (ATIC) Clinical Trials
Clinical Trials | ATIC (svi.edu.au) are studies focused on immune system mediation which means they generally relate to type 1 diabetes. Arguably this is the frontier of type 1 diabetes treatment and has recently seen exciting results with medications such as Teplizumab for delaying the onset of symptomatic type 1 diabetes. Recruitment is across Australia and, at the time of writing, there was even a study recruiting in New Zealand.
Disclosure: I am on the ATIC Community Engagement Panel.
For those of us who read medical papers, it can be rough sailing. The texts are written for medical professionals and not the rest of us. There is the excellent D-Coded Diabetes Research but they have only D-Coded a handful of papers, so what do we do about the rest?
I wondered if AI could come to our aid and it turns out Bing Copilot can be really useful.
Bing Copilot can Read PDFs
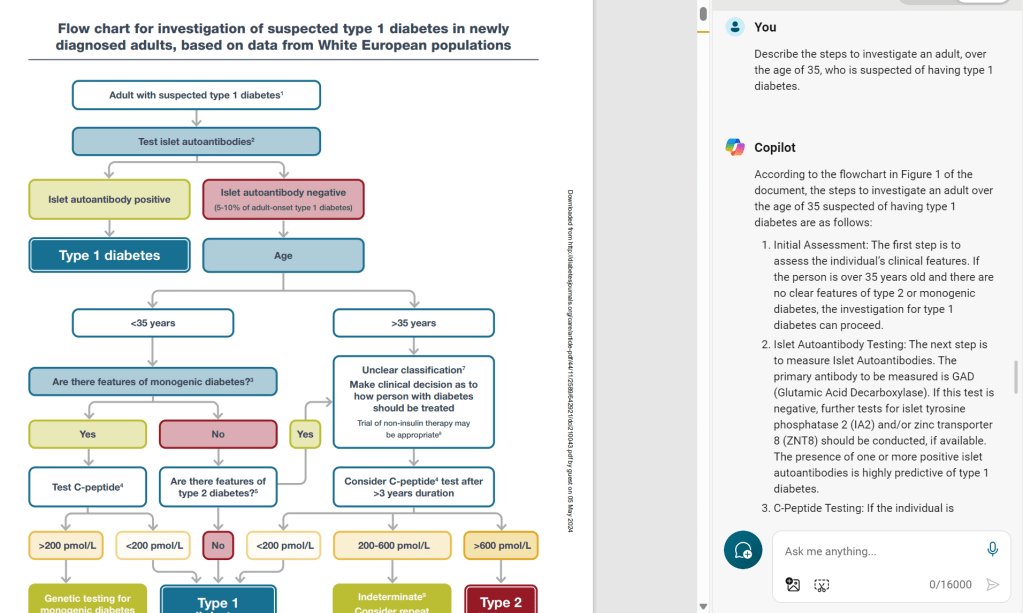
As well as answering questions on web sites, you can open a PDF file in Edge, and Copilot will review the content and answer questions on it, almost instantly. At the time of writing, this is the link for the Type 1 Consensus Report from the EASD and ADA. From here you can open a PDF version of the full report. At 37 pages, I am more than happy for Copilot to navigate the jargon, footnotes and tables instead of me.
So how did it go? The first test was to see if it could read a flowchart. Browsing through the document, I found one describing the diagnosis of type 1 diabetes. Asking what to do for an adult over the age of 35, it did a pretty good job of walking through the process.
My next test was to read a table and return results. It also passed with flying colours and even gave additional context.
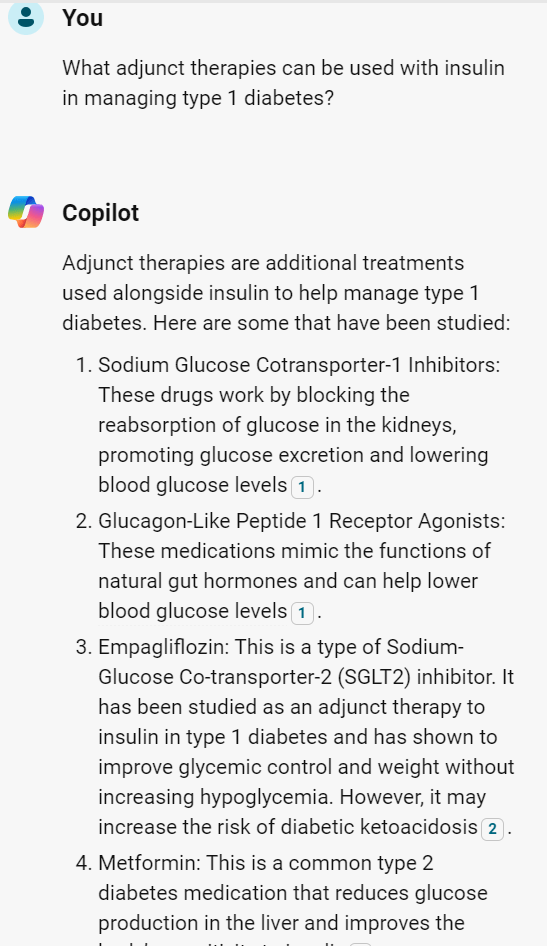
While the above questions were a little artificial to establish it could read the document accurately, we can ask more practical questions such as what medications can be taken to help manage type 1 diabetes (other than insulin).
We need to be careful though as, if we do not specify to use the document exclusively, it will go off to the internet which may or may not be desirable.
Asking this question without confining it to the document brings back a slightly different list of proposed medications.
and while this list is not endorsed by the EASD/ADA consensus we can still assess the sources if we want to explore more.
So What if Copilot Gets it Wrong?
I figured the best person to ask was Copilot themselves and, sure enough, they confirmed it is possible for it to get it wrong and gave sensible advice as a consequence.
As discussed in my article on AI from my other blog, common sense, as provided by a human, should prevail. As Edge Copilot provides sources (and links to where it read the information in the document) it makes sense to double-check these before putting one’s health on the line, using a carefully curated health care team as a sanity check. However, as a tool for quickly reading through a jargon-filled document and pointing me to the key places of interest on a specific topic, I see this as a very useful tool.
My perspective on managing diabetes is it requires a multi-faceted approach. I refer to the strategic elements of this approach as ‘levers’. The way I see it, it is a case of working out how hard you can personally pull each lever and which ones work for you.
What are your Goals?
Before a strategy can be put in place, we must have an idea of where we are heading, what are our goals? These can be big, hairy audacious goals (I want completely normal blood sugars) or smaller ones (I want to reduce my HbA1c). With goals in mind, we can start to use the levers to get us there.
My goals are:
Minimise daily management to avoid burnout
Reduce my HbA1c to a point where my risk of long-term complications is no more than 2x baseline
That’s it! Goals do not need to be complicated and, in my case, one is qualitative (minimise management) and the other quantitative (based on my previous blog, getting an HbA1c under 7.0% is good, getting under 6.4% without hypos is better).
What External Factors Can Hinder Us?
In moving towards our goals, there are factors which may impede our progress. T1D Mum provided this great summary of “social determinants of health” which impact our lives.
While ‘Individual Lifestyle Factors’ speaks directly at the levers I am referring to, as we more further out, our ability to influence the impact on our lives becomes harder e.g. ‘Water and Sanitation’ without significant upheaval to our lives e.g. changing one’s job/home/country or, as t1d mum suggested through advocacy and demand for change. Perhaps we should include advocacy as a lever to address this although it is a slow moving one.
Levers You Can Pull
I brainstormed as many levers as I could think of and went to social media to see what other levels people could come up with.
These are the ones the collective came up with in no specific order:
Food
Sleep
Exercise
Medication
Technology
Health Care Team
Social Media and Online Resources, and Peer Support (care of Tim Street)
Arguably the lever which gets talked about the most and possibly one of the easiest to pull in some fashion. Clearly, reducing the amount of fast-acting carbohydrates will help with blood sugar spikes but, after this, we may adopt a different approach, based on our goals, beliefs, and social context.
For some, a ‘carnivore’ approach is the way to go given muscle tissue has many of the nutrients our body requires with zero carbohydrates. For others, a plant-based diet which reduces insulin resistance makes more sense.
Given how tightly food in woven into human culture, it is hard to give hard and fast rules about how to pull the food lever which will apply universally. Everyone will have an idea of the changes they can practically make to their diet to steer them towards their goals.
Sleep
The CDC gives a great summary of the benefits of sleep for people with diabetes. The very short version is a good night’s sleep is a relatively simple lever to pull to help you towards your goals. Tim Street correctly points out though that adjusting sleep patterns can have unpredictable effects to basal rates and glucose levels (Dawn Phenomenon) so make changes slowly.
Exercise
It is news to no one that exercise is beneficial to health in general and diabetes specifically. Again, I will pull out Dr. Dessi Zaharieva’s exercise slide to summarize the benefits.
Medication
Gone are the days when the only medication for diabetes was insulin. We now have drugs which reduce insulin resistance (Metformin), actively remove glucose from the blood (SGLT2is), and restore the satiety response (GLP1s) as well as many others and many more coming.
It may not be a lever any of us relish pulling but it is there for us to use as we see fit.
Technology
Even in the seven years since my diagnosis, technology has progressed significantly and continues to do so. We now have commercial looping systems which act as an artificial pancreas and, while not perfect, they can provide tremendous benefit in managing, for example, overnight levels.
Health Care Team
A good health care team is vital for good management. They act as a source of expertise as well as a sounding board for your own thoughts and discoveries. The ability to engage with the health care team or adjust its composition varies greatly from, for example, rural to urban areas which can limit how much this lever can be pulled and how effective it is.
Social Media, Online Resources, and Peer Support
Another resource for information and ideas, social media, online resources and peer support, like the health care team should be carefully curated so they work for you, rather than against you. Unlike the health care team, a lot of what is found online is unregulated so, even more than the health care team, critical thinking is needed to work out what is useful, what is unfounded, and what the agenda is behind the information. For example, I trust PubMed much more than medical ‘evidence’ from Twitter or Facebook. However, in terms of looping and success in managing LADA, online discussion groups have been essential. As Tim Street puts it “Peer Support…opens minds to methods that may help…”
Family, Friends, and Allies
Online support is one lever but support in the real world is another we can pull. As Tomorrow’s Gone suggests, having family and friends who are ‘followers’ to CGM data, who can help out on sick days, tell you when dinner is going to be ready so meals can be effectively managed, or do supply-runs when they unexpectedly run out is a great asset to have. Tomorrow’s Gone also mentions making allies of others such as the school a person with type 1 diabetes attends by providing a care plan.
Financial Status
There is flexibility in money and, therefore, financial status can greatly impact our success in managing diabetes. It is also one of the hardest levers to pull given the inherent expense in managing diabetes and the financial commitments of everyday life e.g. we may want to use certain technologies or medications but cannot afford them. Therefore, getting financial advice and stabilising finances with a budget can be a great lever to pull.
Time
As we can plan our finances, so too we can plan our time and give ourselves flexibility to explore other levers such as exercise or sleep. While none of us want to be a slave to a strict time regime, some planning and organisation can provide benefit.
Stress/Wellbeing/Mental Health
Stress hormones can cause havoc with blood glucose levels and maintaining good mental health is vital to keep the diabetes gremlin in its cage. Whether it is doing something relaxing such as meditation or yoga, or regularly seeing a mental health professional, there are ways we can keep our mind clear to tackle the demands of the body.
Education
This arguably overlaps with some of the other levers such as having an effective health care team and making good use of online resources but, as it also covers physical media such as books or university courses, I have called it out as a distinct lever.
Also, you are your best advocate in managing this disease. You know your body better than anyone and have the greatest motivation to keep you healthy. Arguably, this can only be done if you are educated about your body, about diabetes, and about the levers you intend to pull.
Education regarding your own body is an interesting one because this knowledge can only come from self-experimentation and not from the internet, a book, or a university. Dave Dikeman mentions practical knowledge of insulin dosing as an example which is vital if manually injecting and can be quite individual, depending on insulin resistance and diet.
Education can come from a variety of sources, such as those mentioned, and, for me, empowers and amplifies many of the other levers available.
No Lever Acts in Isolation and Levers can be Inconsistent
As you read through it may have occurred to you that some levers affect others, as mentioned with education. Also, levers may not always act the same way. For example, with a women’s monthly cycle insulin resistance can significantly change, affecting the way insulin, food, and exercise impact the body.
For this reason, I believe there is not one lever which is more important than any other and over-reliance on any one lever can set us up for failure. For example, an over-reliance on technology means we may be in big trouble if it fails. Using diet, being educated on how to inject safely as a backup, and having a robust support network means we have contingencies if technology fails. As Steve Norris sums it up “I think the problem is that the levers don’t pull consistently, nor do they act in isolation. A holistic, yet unburdened, approach is important…”
The standout talk for me at ATTD2024 was by Doctor Dessi Zaharieva on making exercise guidelines practical. It was standout for a couple of reasons. Firstly, it was a great talk, accessible to people of all academic levels and secondly, it was practical: the guidelines presented can be used by people with type 1 diabetes easily and without a pocket calculator/slide rule (am I aging myself with that reference?) on hand.
You may also recall that, back in November, I did a post on a talk by John Pemberton at ISPAD2023 (also mentioning Dessi) on the same topic.
This blog will look to bring together the two talks (and my own experiences running the Blue Circle Cycle Club) so others can use the knowledge and, hopefully, it will encourage them to incorporate exercise into their type 1 management routine. The focus will be on bike riding but feel free to follow the links for tips on other forms of exercise.
What Did John (and Dessi) Say at ISPAD 2023? A Recap of my Previous Post
In my previous post, I had the following key points:
Exercise, as it increases your heart rate, makes insulin stronger and last longer as it gets to circulate around the body more before it is broken down by the liver and kidneys
Aerobic exercise tends to lower blood sugar levels which, combined with the ‘amplified insulin’ can make hypoglycemia more likely
Exercise has many benefits and Dessi expresses it really well in just one slide
A Continuous Glucose Monitor (CGM) is really useful when exercising as it gives you near-real time feedback on your blood sugar levels, allowing you to address any hypos before they become an issue. For people not using CGMs, Hypoactive suggests “test your blood glucose (BGL) at least twice, 15-30 minutes apart before you exercise.” to understand the direction you are trending and regularly test during exercise.
Non-Looping Food Strategy: Eat before exercise to bring you up to around 7-10mmol/L (126-180mg/dL) to act as a buffer against going low
Non-Looping Insulin Strategy: Reduce basal insulin by 20% leading up to exercise, adjust in subsequent rides if too high/low
Looping Food Strategy: None. Cannot eat to raise BGLs as the loop will counter it, unless you deactivate the loop and follow the MDI/Non-Looping strategy
Looping Insulin Strategy: Raise BGL target level to, say, 8mmol/L (144mg/dL) and set system to ‘exercise mode’ if available when exercising
Roughly speaking, if you are at your target level when exercising, take around 15g of carbohydrates every 20 minutes to maintain it. If you are above but dropping fast, take the same, if you are below and heading upwards take the same and if you are below and flat or heading downwards, take more than 15g of carbohydrate per 20 minutes
Hypoactive suggests monitoring glucose levels for at least 24 hours after exercise and Diatribe recommends reducing bolus insulin by 50% for meals or snacks up to two hours after exercise.
What is Dessi Saying at ATTD2024?
Dessi, via Dana Lewis, generously gave me a copy of her slides so I have much clearer images for this blog than my original tweets.
I will focus on presenting the ‘practical’ slides than give the full presentation.
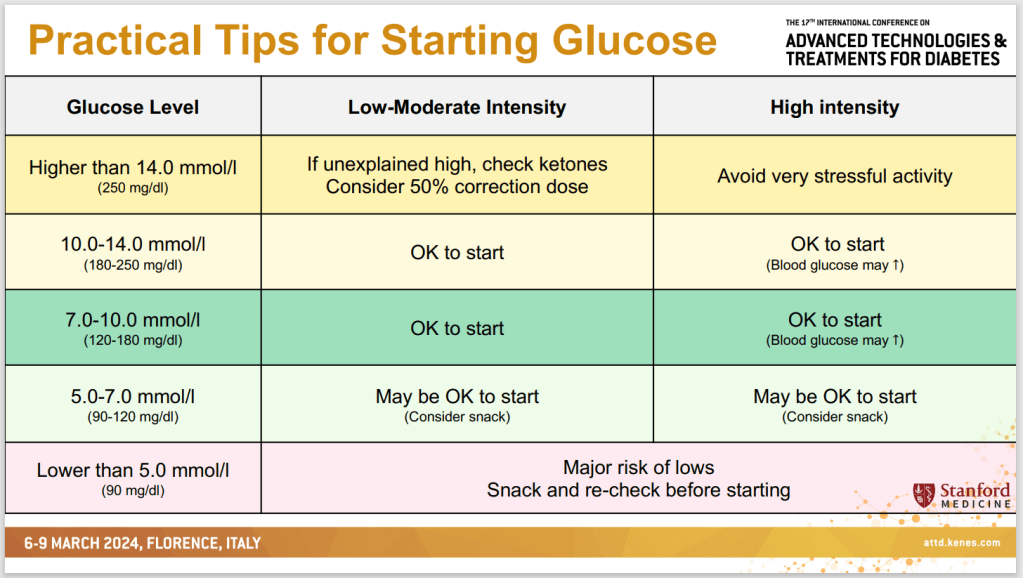
Starting Glucose
Bike riding is considered a Low-Moderate Intensity exercise so the suggestion is to start between 7-14mmol/L (126-252 mg/dL) which is in broad agreement with the previous advice.
Mealtime Insulin Before Exercise
In my previous blog, Diatribe had suggested reducing bolus injections by up to 50% leading up to exercise and we see here this is in broad agreement, especially with Low-Moderate exercise.
Basal Insulin Before Exercise
For non-loopers, John’s position was to reduce basal insulin by about 20% before exercise. Arguably Dessi’s position is not as strong saying a 10-20% reduction is only needed if the day is unusually active but, with John’s suggestion to adjust based on experience, we can see there is a middle ground between the two positions.
Snacks During Exercise (CGM)
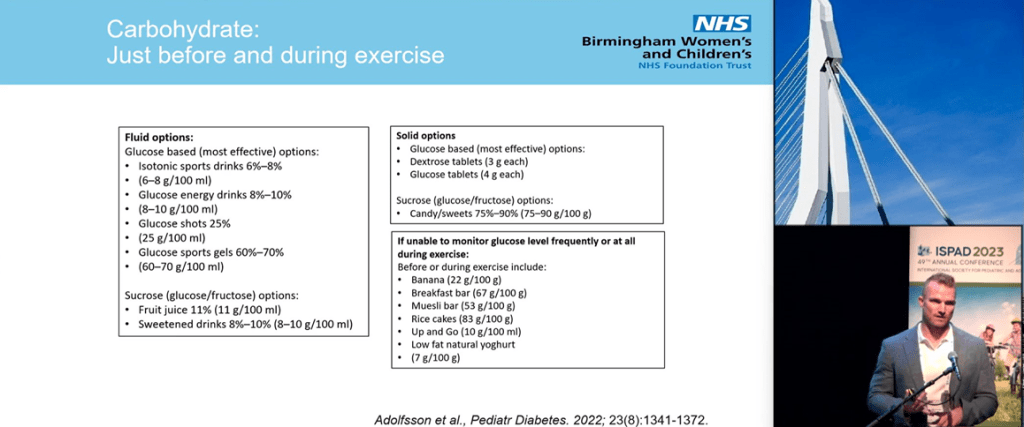
Again, we see broad agreement with John’s talk. In terms of what to do below target, the softer language here allows room for John’s ‘maintenance carbs’ that he suggests (around 15g every 20 minutes). I should note here that my experience has been that, while I initially needed a protein bar before exercise to stave off lows, as my stamina/fitness improved, the need to do so has diminished. For example, the 10km/6 mile ride I did today I did without breakfast and no protein bar and stayed flat.
Dessi also suggests a backup glucose monitoring kit (good idea, especially for longer exercise intervals) and makes the excellent point that, as CGM can lag the true BGL value, a drop in BGL should be attended to as early possible.
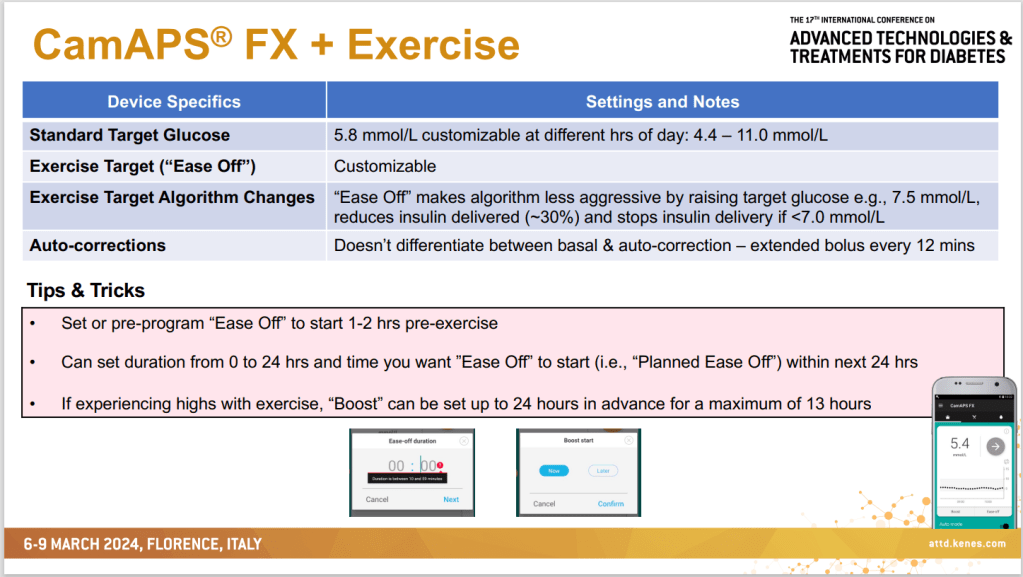
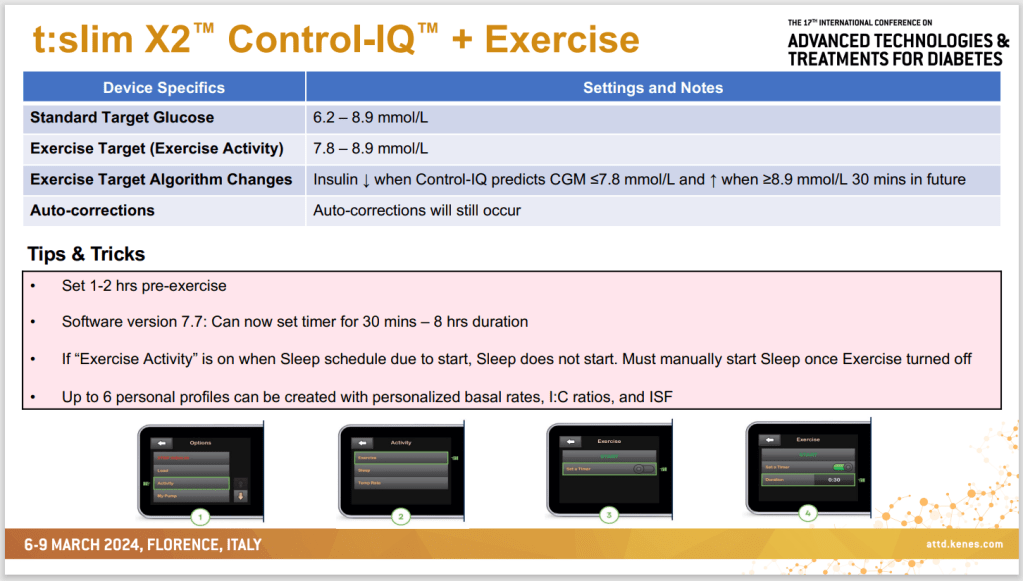
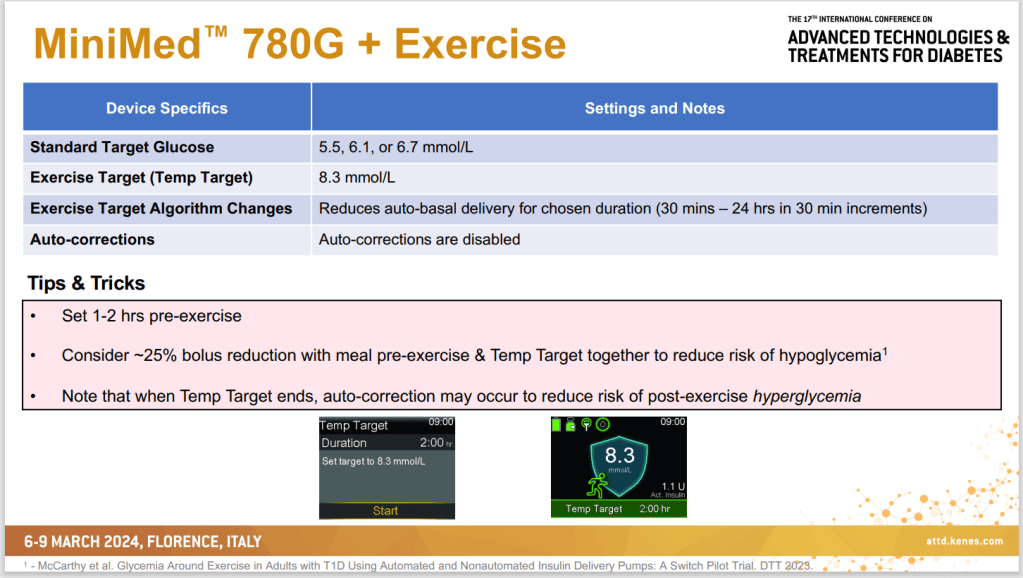
Looping Settings For Exercise
John also had a table of pump settings (screenshot in my previous article) and Dessi’s are in broad agreement. As they are friendlier to read, I am including hers here (sorry John).
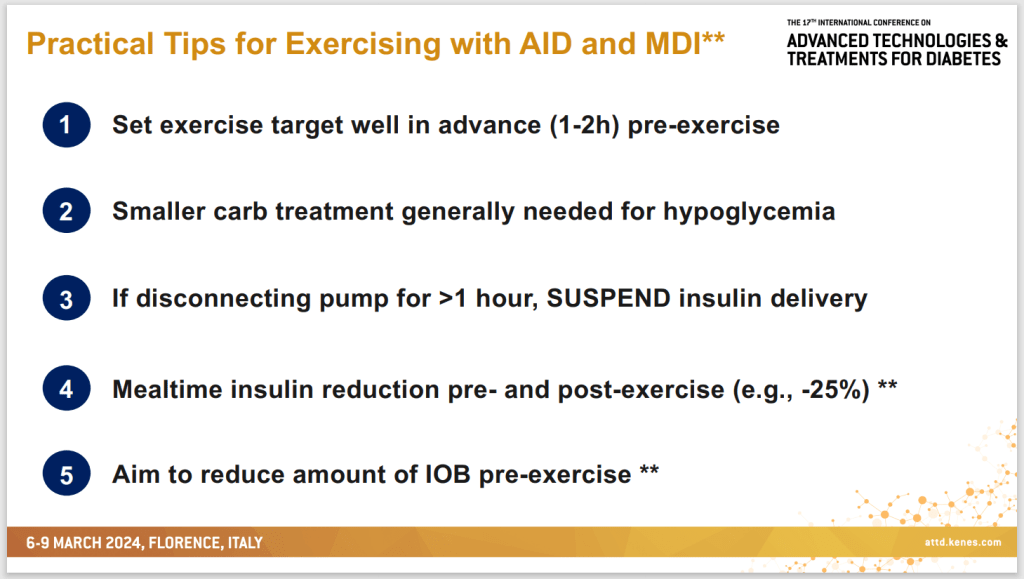
Dessi’s Summary and What Really Happens
This was her summary slide combining tips for loopers and non-loopers. Again, nothing too unusual here, compared to previous tips but all good information.
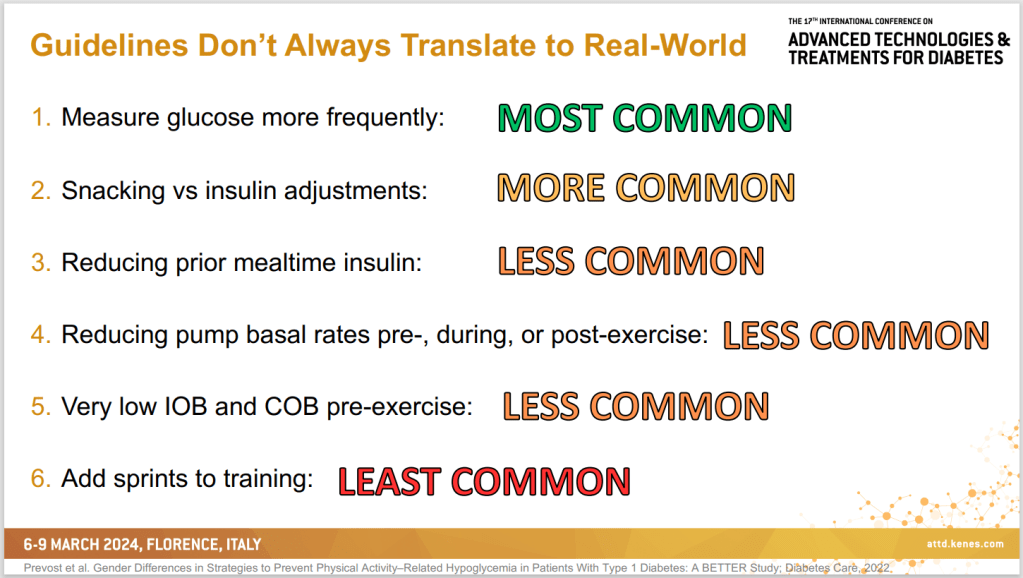
Of course, as she was going through all the suggestions I was thinking “yes, I will do that” and “no, I will not bother with that” and, as if she was reading my mind, she showed the slide above which aligned perfectly with my thinking.
Points 3-5 all relate to pre-exercise guidelines. I had dismissed these because, with a family, I cannot guarantee exactly when I will be starting exercise. For me it makes more sense to start following guidelines when I am about to ride, making points 1 and 2 the most relevant/practical.
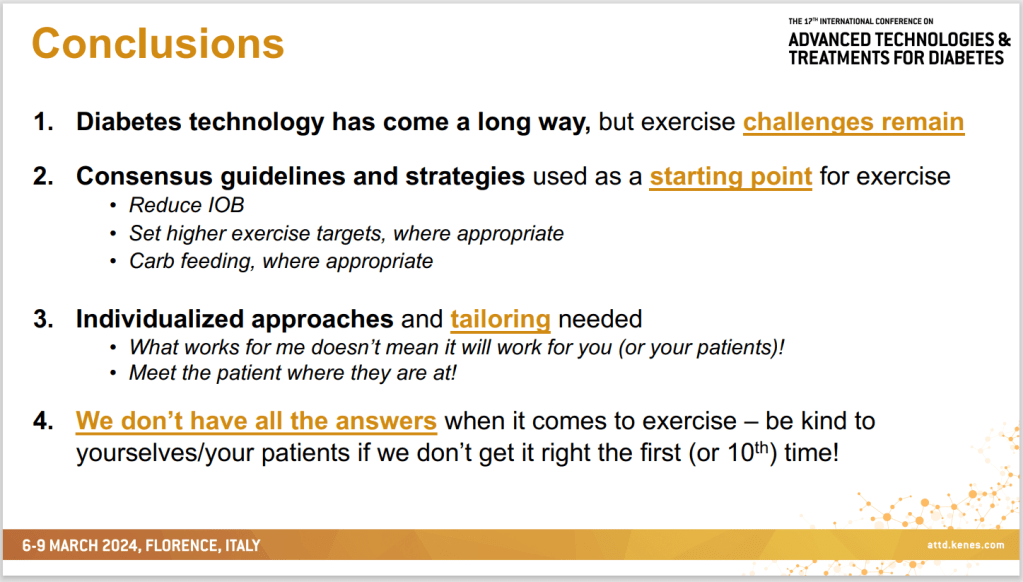
Her conclusions align to what many of us with type 1 diabetes concluded long ago when it comes to managing our blood glucose levels: Academic guidelines are well and good, but everyone’s diabetes is different, and we need to work out what works for us.
Things to Take on the Ride
From my own riding adventures, these are the things I keep on me while riding. For storage, you can pick up very affordable bike storage bags/panniers on the usual sites (Amazon, eBay, etc.)
A phone so you can monitor your CGM levels and/or a blood testing kit if you are not using a CGM. A phone can also be used to track your riding time and distance via apps like MapMyRide and Strava.
Hypo snacks (long and short-acting) to treat hypos and stave them off during exercise. John had some excellent examples
A medi-bracelet so, if there are issues, it can be quickly identified that you are a person with type 1 diabetes. Like the bike storage bags, these can be easily picked up online
Sunscreen, especially if you are cycling in the sun
Hydration: A riding bottle and bottle holder should be part of the bike or, you can also get wearable water bladders if you want to drink hands-free
Appropriate clothing: Some bike shirts have zippable pockets for storage or otherwise, simply clothes which allow movement and you will not get too hot in. I have picked up some excellent bike clothing and accessories at second-hand clothing stores
A smart watch: This is more a nice-to-have but I personally find it easier to check my BGLs on the watch by tapping it to my chin, than messing with the phone which is usually tracking the ride and not showing my BGLs
Bringing Together the Strategies for the Ride
Along with bringing the above along, here is the overall strategy summary for a morning bike ride, like those of the Blue Circle Cycling Club using my last post’s strategy as the foundation. Also note that, in the real world, people do not do all these things so work out which ones work for you.
Glucose Levels
Non-Looping: 1-2 hours before, have a Low GI breakfast to raise glucose levels with a reduced bolus (around 25-50%) to minimise insulin on board AND/OR reduce basal rates (10-20% reduction) to allow blood glucose levels to rise to around 7-14mmol/L (126-152mg/dL)
Looping: Skip breakfast, and 1-2 hours before set a higher loop target (around 8mmol/L = 144mg/dL) OR disable looping and follow the Non-Looping approach
During the Ride
Monitor glucose levels and, if they are dropping, eat a snack to counteract the trend.
If you already know how long you can exercise before levels start to drop, eat snacks accordingly. If unsure, start with eating around 15g of carbohydrate every 20 minutes of exercise.
After the Ride
Have a snack/coffee post-ride, especially if you are driving home
Monitor blood glucose levels for up to 24 hours
Reduce bolus rates by 25-50% up to two hours are the ride
Make any necessary adjustments to the approach for the following week.
I have just returned from ATTD 2024 in Florence, Italy thanks to dedoc. ATTD (Advanced Technologies and Treatments for Diabetes) is one of the largest diabetes conferences in Europe. While the formal focus is on technology and new medications, the research coverage was quite broad. for example, I had a poster at the conference talking about motivation theory and its application in the doctor’s office.
I also presented on the petition to guarantee the humanitarian supply of medication, including insulin, to civilians in war-affected areas, in line with documents such as the Geneva Conventions. If you are interested in signing the petition, please go to https://www.change.org/insulinconsensus
In the spirit of Michelle Law’s Top Ten Takeaways and dedoc’s #PayItForward, I thought I would list the topics presented which piqued my interest.
Non-Invasive Glucose Measurement
In the expo area of the conference were a lot of companies looking to measure glucose in non-invasive ways, such as through saliva or with various electromagnetic waves scanning the skin. The measure of choice for determining accuracy for these systems is MARD (Mean Absolute Relative Difference). Generally speaking, a MARD less than 10% is considered accurate enough to inform insulin delivery i.e. be included in a bolus/looping system.
To understand how MARD can be manipulated look no further than Tim Street‘s excellent reviews of CGMs and how their accuracy is assessed, such as this one. However, even with the ability to artificially lower the numbers, the lowest MARDs being reported were in the low teens so, at least for now, finger-pricking and CGM insertion will need to continue.
TITR Gets More Coverage
At last year’s ATTD blog article, I mentioned Professor Thomas Danne pushing for Time in Tight Range (TITR, 3.9-7.8 mmol/L = 70-140mg/dL) rather than the usual Time in Range (TIR, 3.9-10 mmol/L = 70-180mg/dL) because it is a better predictor of the onset of Stage 3 diabetes and a better target for minimising the risk of long-term complications. In short, he suggested the evidence-based 50% TITR was a better goal than the consensus-based 70% TIR.
At this year’s ATTD, there was more talk of TITR and it is clear it is becoming an accepted standard in academic research. Some of the other dedoc voices expressed concern that a stricter range could lead to more pressure on people with diabetes (PWD) to ‘succeed’. While I am sympathetic to this concern, I would prefer my targets to be evidence-based but, to make sure people do not over-obsess on the numbers, perhaps a multi-target strategy should be considered with both quantitative and qualitative measures, aligned to the PWD’s goals.
Continuous Glucose Monitors (CGMs) and Looping for Type 2 Diabetes
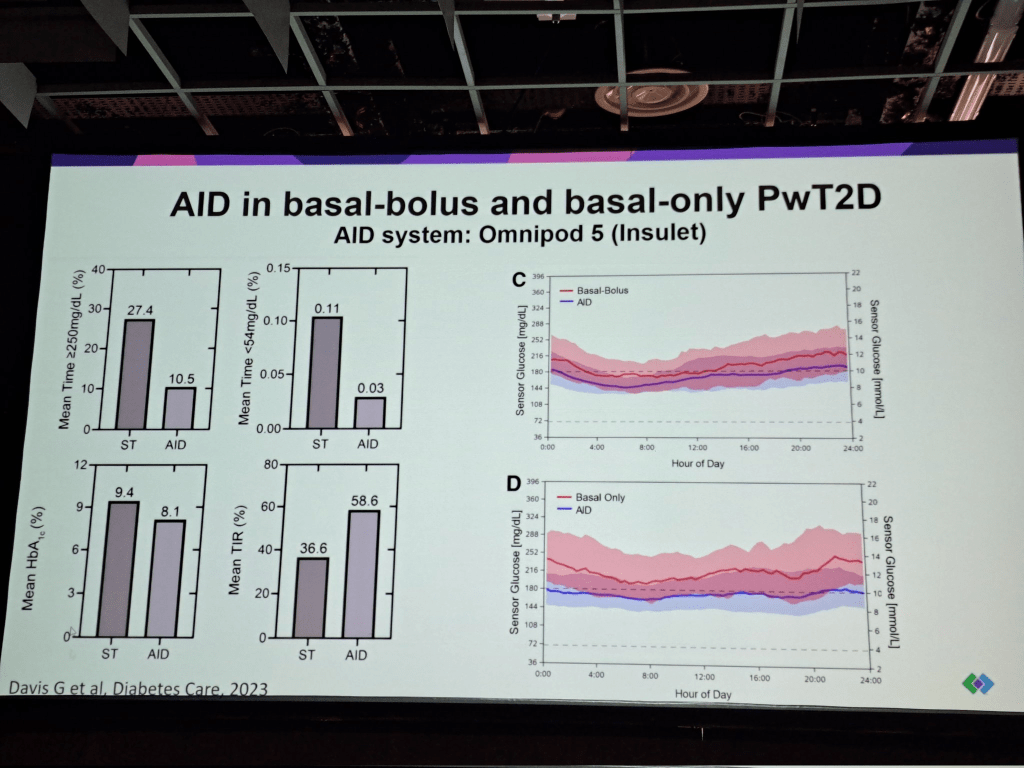
Historically, CGMs and Looping technology has been considered a type 1 tool. However, there are people with type 2 diabetes who require insulin and, from a common-sense perspective, based on the type 1 evidence, it makes sense they would also benefit from the technology. ATTD 2024 presented a variety of studies which confirmed this. Given the type 2 diabetes market is literally ten times the size of the type 1 diabetes market, it makes sense that diabetes tech. companies would pursue it.
Continuous Ketone Monitoring
The idea of monitoring ketones continuously, as well as blood sugar was also presented. It was shown that rising ketones can be used to predict hyperglycemia spikes and potentially predict DKA before it becomes dangerous. Abbott even went as far as to talk about a future all-in-one sensor which would track both in the one unit. Where I see this being useful is providing additional information for looping systems, to predict exercise, better handle ketogenic diets and SLGT2i medications.
GLP1s for Obesity Management
Drugs like semaglutide (Ozempic/Wegovy) are “single agonist GLP1s”: they bind to cells and trigger the same response as GLP1s in the body. The next generation of these drugs are in trials, referred to as double or triple agonists i.e. they activate more receptor sites. The upshot is they are more effective than their single agonist predecessors. How effective? Trials are reporting people losing 20-30% of their weight on the drugs which is incredibly powerful.
LADA Confirmed as a Distinct Phenotype and “Curable”
Perhaps because ATTD was in Italy, the home of Professor Raffaella Buzzetti, one of the leading authorities on LADA, there was substantially more coverage of LADA than I had seen in previous conferences. Professor Buzzetti presented evidence showing LADA is a distinct phenotype of type 1 diabetes (a distinct disease that presented differently) and confirmed that, with immune intervention drugs such as Teplizumab, it may be possible to indefinitely hold off LADA from becoming insulin dependent i.e. a cure.
#LanguageMatters Becomes #DeliveryMatters
One presentation talked at, not so much the words we use in speaking with people with diabetes but, how we talk to them i.e. with empathy and respect. This is a shift in the #LanguageMatters movement but a welcome one.
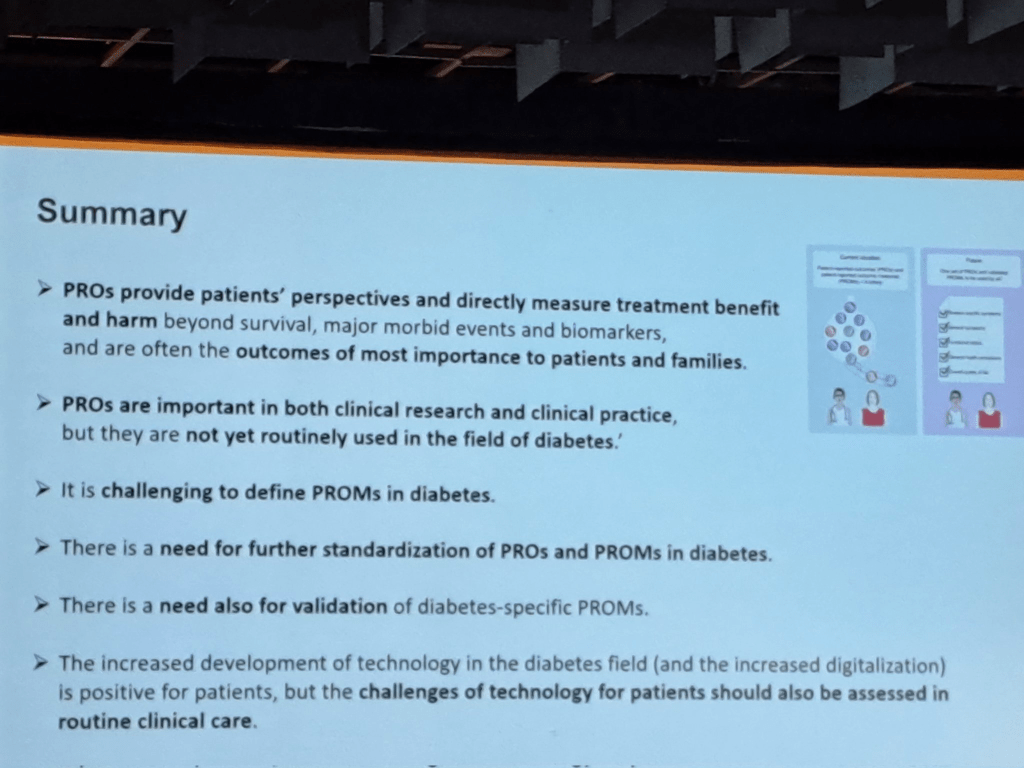
Patient Reported Outcomes (PROs) and Measures (PROMs)
This had been touched upon in previous conferences but, again, seemed to have more prominence at ATTD 2024. In short, PROs are outcomes which are important to the person with diabetes, more than the clinician.
PROMs are the measures to assess them. At this stage, while there are PROM questionnaires being used in research, their efficacy is not strongly validated, and there is concern they are being used without a purpose in mind.
“Artificial Intelligence is not Ready for Primetime”
The use of artificial intelligence (AI) systems to provide guidance to people with diabetes in their daily management and in providing general advice on diabetes was discussed and considered not ready for general use because of ‘hallucinations’ (false facts incorrectly inferred by the AI engine which need to be verified by the user). Examples cited included mixing up mmol/L with mg/dL which could be disastrous in the context of giving insulin administration advice.
This being said, the potential was recognised once obstacles were addressed.
Tips and Tricks for People with Type 2 Diabetes
One study was presented which showed, even if the types of food a person with type 2 diabetes is eating does not change, intermittent fasting will still reduce their HbA1c. This is intuitively obvious, but it is good to have the evidence to back it up.
Another study showed 2.5-6.5 hours of exercise per week helps people with early stages of type 2 diabetes inproves beta cell function.
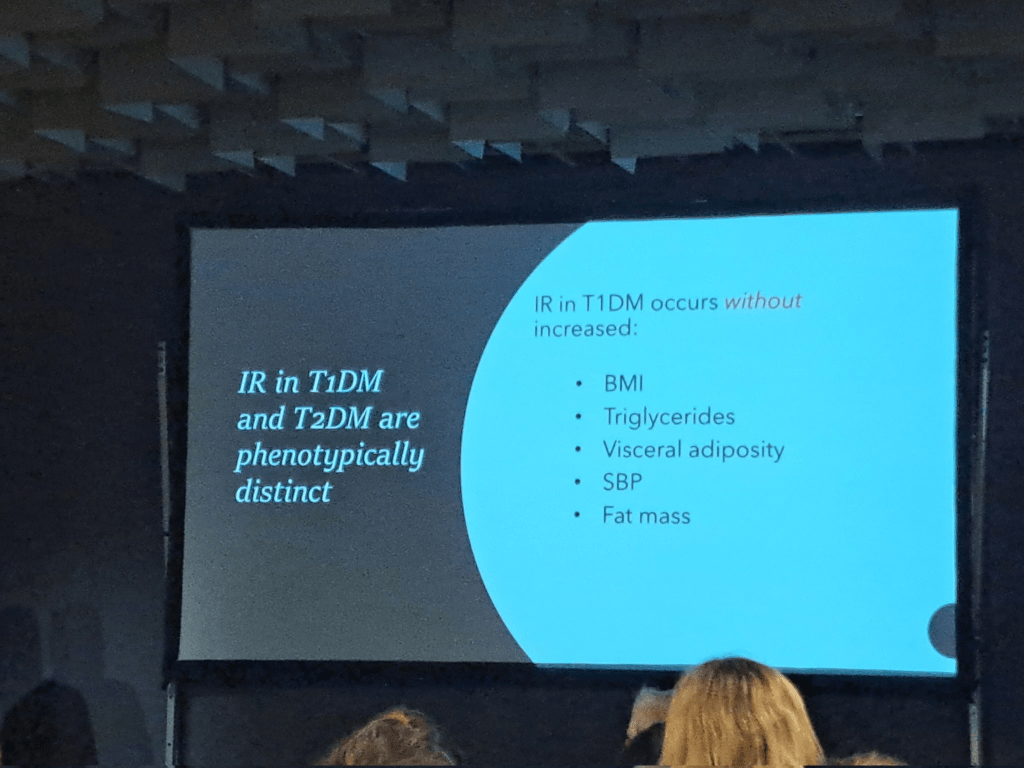
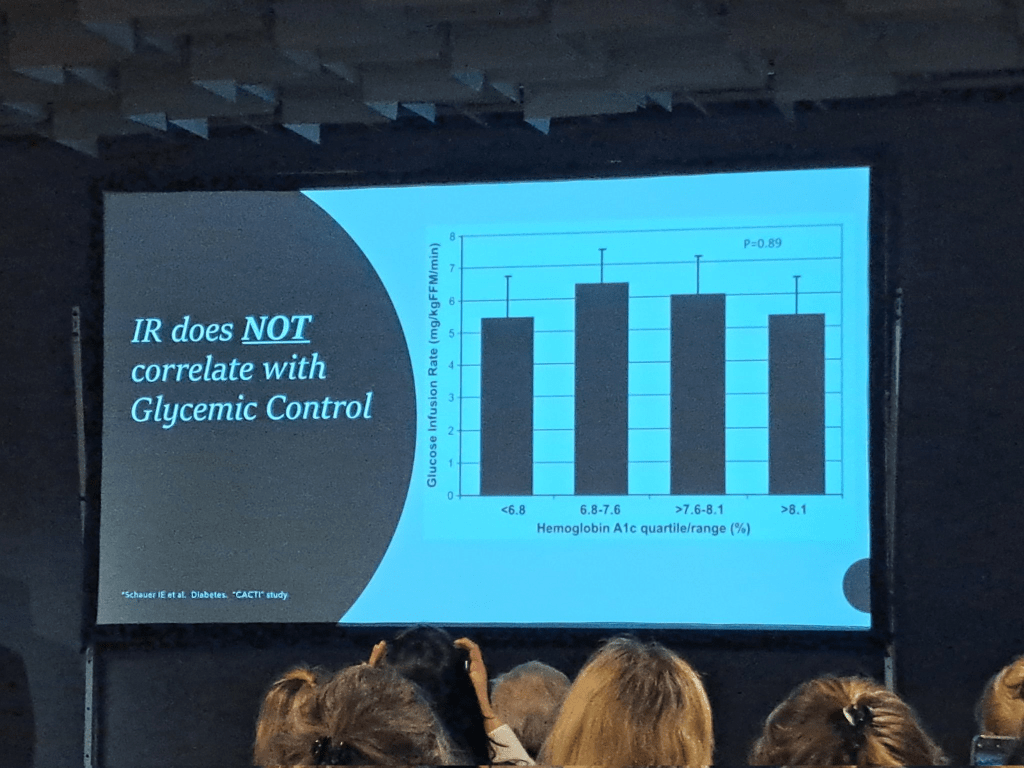
Type 1s have Insulin Resistance Too!
Rendering the term “double diabetes” somewhat redundant, it was shown that people with type 1 diabetes also have insulin resistance which, in their case, is driven by the insulin they inject and is independent of factors such as weight or glycemic control. Low carb was mentioned as one lever to pull in managing it.
Thank You dedoc!!
If you are interested in also attending these kinds of conferences, I highly recommend going to the dedoc web site and applying for one of their scholarships. They cover flights, accommodation, and conference registration. Am I one of these infamous “paid diabetes advocates” we hear so much about on social media? I do not think so. I still had to take leave from work and cover other expenses out of my own pocket. My bank account is no richer for the experience but my knowledge of where the research is heading certainly is and the friendships made with other diabetes advocates around the world are priceless. This is why I continue to apply for the scholarships for myself and for the communities I serve.
Imagine a bomb which kills by removing air with its blast. Armor would be useless against it and civilians would have no defense. The only way to survive would be to have a personal supply of oxygen to breathe until air returns to the area. Such a bomb does exist; it is called a thermobaric bomb and it has been used in warfare. Thankfully, it is seen as something exclusively for the battlefield and, while not banned, its use on civilian populations is seen as possibly contravening the Protocol on Incendiary Weapons.
This article is not a treatise on the nastier weapons at the disposal of modern armies but asks the question “Should a civilian population be given what they need to survive in times of war?” If we think of the basics a person needs to survive, we can imagine this includes food, water, and shelter but what about medication? There are diseases, such as type 1 diabetes, where the absence of medication (insulin) literally means death. There is no remission for type 1 diabetes, there is no substitute for insulin. A person with type 1 diabetes needs insulin as much as they need air, food, water, and shelter.
So, do the international conventions go as far as provisioning medication for those who literally cannot live without it?
International Declarations, Covenants, and Conventions
Article 5: No one shall be subjected to torture or to cruel, inhuman or degrading treatment or punishment.
Article 12.1: Everyone has the right to a standard of living adequate for the health and well-being of himself and of his family, including food, clothing, housing and medical care and necessary social services, and the right to security in the event of unemployment, sickness, disability, widowhood, old age or other lack of livelihood in circumstances beyond his control.
Article 6.1: Every human being has the inherent right to life. This right shall be protected by law. No one shall be arbitrarily deprived of his life.
Article 7: No one shall be subjected to torture or to cruel, inhuman or degrading treatment or punishment. In particular, no one shall be subjected without his free consent to medical or scientific experimentation.
Article 3.1: Persons taking no active part in the hostilities, including members of armed forces who have laid down their arms and those placed hors de combat by sickness, wounds, detention, or any other cause, shall in all circumstances be treated humanely, without any adverse distinction founded on race, colour, religion or faith, sex, birth or wealth, or any other similar criteria.
Article 3.2: The wounded and sick shall be collected and cared for.
Article 56: To the fullest extent of the means available to it, the Occupying Power has the duty of ensuring and maintaining, with the cooperation of national and local authorities, the medical and hospital establishments and services, public health and hygiene in the occupied territory, with particular reference to the adoption and application of the prophylactic and preventive measures necessary to combat the spread of contagious diseases and epidemics. Medical personnel of all categories shall be allowed to carry out their duties.
Article 12.1: The States Parties to the present Covenant recognize the right of everyone to the enjoyment of the highest attainable standard of physical and mental health.
Article 12.2: The steps to be taken by the States Parties to the present Covenant to achieve the full realization of this right shall include those necessary for…The creation of conditions which would assure to all medical service and medical attention in the event of sickness.
Article 6.1: States Parties recognize that every child has the inherent right to life.
Article 6.2: States Parties shall ensure to the maximum extent possible the survival and development of the child.
Article 24.1: States Parties recognize the right of the child to the enjoyment of the highest attainable standard of health and to facilities for the treatment of illness and rehabilitation of health. States Parties shall strive to ensure that no child is deprived of his or her right of access to such health care services.
Article 24.2: States Parties shall pursue full implementation of this right and, in particular, shall take appropriate measures:
(a) To diminish infant and child mortality;
(b) To ensure the provision of necessary medical assistance and health care to all children with emphasis on the development of primary health care;
Article 27.1: States Parties recognize the right of every child to a standard of living adequate for the child’s physical, mental, spiritual, moral and social development.
Article 37: States Parties shall ensure that… No child shall be subjected to torture or other cruel, inhuman or degrading treatment or punishment.
Conclusions and Call to Action
I have included a couple of provisions regarding torture because this is a fitting description for what a person with type 1 diabetes goes through if they do not have insulin. Without insulin, the body breaks down and floods the blood with fuels such as glucose, fatty acids, and ketones. The blood turns acidic and the organs of the body are slowly destroyed. Any ‘state party’ engaged in war and knowingly restricting the movement of insulin is, in my opinion, committing an act of torture. I appreciate others may see it differently.
Obviously, wars make life difficult for those who cannot escape. Inevitably, civilians get caught in the crossfire literally and figuratively. However, if those engaging in war are signatories to the documents above or endorse their principles, it is reasonable to expect them to stand by their commitments. The movement of humanitarian aid and medication should not be weaponized by being withheld, confiscated, or destroyed. To do so is to lose sight of the values often being fought for in the first place.
To this end, myself, and a collection of international diabetes advocates have put together a petition which you can sign urging warring nations to meet their international obligations. While the catalyst for the creation of the petition was the Russia-Ukraine conflict and the Israel-Gaza conflict, this petition is not directed at any one nation and simply demands that if a nation is to be recognized as an international citizen, it must act as one. I urge you to endorse this position so that the international bodies that our group represent, or have ties to, can put pressure on the relevant parties and save the lives of people who will otherwise die.
About a month ago I put out a Sick Day Plan Template. In this blog I have put together a broken pump plan template. This is a plan to follow if you use an insulin pump and it has a systematic failure.
Unlike the Sick Day Plan, there are Broken Pump Plans out there so I have merged a few of them to create what I believe to be a practical approach to a disastrous event. The main sources for this template are:
As with the Sick Day Plan, I am not a medical professional so I strongly recommend running your version of this plan past your health care team before using it.
The Template
Contacts
Relationship
Name
Contact Number
Diabetes Educator
<DE Name>
<DE Phone Number>
Insulin Pump Supplier
<Pump Support Name>
<Pump Support Number>
Things to Carry
Short-acting insulin
Long-acting insulin
Needles for injection
Glucometer and strips
Lancet/Genteel
Ketone strips
Hypo snacks
Pump Settings
Target
<Target blood glucose level>
IC ratio
<IC ratio number>
Grams of carb 1 unit of insulin covers
ISF
<ISF number>
The amount blood glucose levels drop with a unit of insulin
Basal
<Basal number>
How many units per hour needed for basal insulin
TDD
<TDD number>
Total daily insulin usually used (bolus + basal)
NB: This is quite a simplistic profile as it assumes no variation over the day. Also, if looping, numbers may not be accurate as the loop may have adjusted the profile within its algorithm so monitoring is essential.
DKA Symptoms to Watch For
DKA usually develops slowly. Early symptoms include:
Being very thirsty.
Urinating a lot more than usual.
If untreated, more severe symptoms can appear quickly, such as:
Fast, deep breathing
Muscle stiffness or aches
Dry skin and mouth
Being very tired
Flushed face
Nausea and vomiting
Fruity-smelling breath
Stomach pain
Headache
Steps to Follow
NB: Assumes a mechanical/electrical pump failure, not a cannula issue
Call the pump manufacturer to report the fault and find out when a new one can be delivered
If tech support can’t fix it, stop the pump and disconnect it
If you have one, activate your spare pump
If off the pump for less than 3 hours:
Check blood sugar
If above target inject rapid insulin to bring it down, if very high (>14 mmol/L, >250mg/dL) check for ketones
If showing signs of DKA (thirsty, excessive urination, vomiting, headache, exhaustion), check for ketones, regardless of BGLs
If ketones above 1.5mmol/L, double the correction dose (or add 10-20% of your TDD), drink a glass of water every 15 minutes. If BGLs are not high, also eat a hypo snack to counter the extra insulin
If you eat, inject rapid insulin to match the carbs
If off the pump for more than 3 hours:
Check blood sugar every 4 hours
Calculate the basal insulin needed for 4 hours
Inject enough rapid insulin to cover it
If above target inject rapid insulin to bring it down, if very high (>14 mmol/L, >250mg/dL) check for ketones
If showing signs of DKA (thirsty, excessive urination, vomiting, headache, exhaustion), check for ketones, regardless of BGLs
If ketones above 1.5mmol/L, double the correction dose (or add 10-20% of your TDD), drink a glass of water every 15 minutes. If BGLs are not high, also eat a hypo snack to counter the extra insulin
If you eat, inject rapid insulin to match the carbs
If without a pump overnight and do not have long-acting insulin, continue every 4 hours
If off the pump overnight or more than one day with long-acting insulin:
Check blood sugar every 4 hours
Calculate 24 hours total basal (or 2*12, whichever works)
Inject long-acting insulin to cover it
If above target inject rapid insulin to bring it down, if very high (>14 mmol/L, >250mg/dL) check for ketones
If showing signs of DKA (thirsty, excessive urination, vomiting, headache, exhaustion), check for ketones, regardless of BGLs
If ketones above 1.5mmol/L, double the correction dose (or add 10-20% of your TDD), drink a glass of water every 15 minutes. If BGLs are not high, also eat a hypo snack to counter the extra insulin
If you eat, inject rapid insulin to match the carbs
Reintroducing a new pump:
If not looping or having basal suspension, consider the insulin on board before activating the basal rate of the pump. For example, reconnect when you would otherwise give yourself a basal shot
I just put together a Sick Day Plan/Guide for my Family in Case I am unconscious. I thought I would share it so others can craft it to make it their own. The guidelines are taken from the Australia Diabetes Education Association (https://www.adea.com.au/wp-content/uploads/2020/09/Consumer_01_10.pdf)
I have written them for someone with a pump (because I have a pump) and while the administering of insulin can be done with a pump, in an emergency, I made the call that a family member would be more capable of injecting insulin than checking if a pump still had insulin and using it to give a bolus.
I am not a medical professional so I strongly recommend running your version of this plan past your health care team before using it.
The Template
Sick Day Plan
Contacts
Relationship
Name
Contact Number
Partner
<Partner Name>
<Partner Phone Number>
Endocrinologist
<Endo Name>
<Endo Phone Number>
Diabetes Educator
<DE Name>
<DE Phone Number>
GP/Family Doctor
<GP Name>
<GP Phone Number>
Dentist
<Dentist Name>
<Dentist Phone Number>
Cardiologist
<Cardiologist Name>
<Cardiologist Phone Number>
What To Do When Sick/Unconscious (Looping Insulin Pump Plan)
FAMILIARISE YOURSELF WITH THE INSTRUCTIONS BEFORE ACTIONING THEM
If feeling unwell, Leon is unconscious, or BGL > 15mmol/L (270mg/dL) for more than 2 hours
Check Blood Glucose Levels (BGLs) and Ketone Levels
Continue to drink (0.5-1 cup of fluid per hour) and eat if possible (15g carb per hour)
If BGLs greater than 10mmol/L (180mg/dL)
Low carb intake and use insulin (<Inset enough to get you down to, say, 4mmol/L (72mg/dL))
If BGLs less than 4mmol/L (72mg/dL)
Take fast acting carbs
Check BGLs every 15 minutes and treat until above 4mmol/L (72mg/dL)
If ketones 0.6 – 1.5mmol/L (60 – 150 mg/dL)
Change pump site
Check BGL/ketones every hour
Give 20% of your Total Daily Dose (TDD) of insulin every two hours.
If ketones >1.5mmol/L (150mg/dL)
Give 30% of your TDD every two hours
Otherwise
Check BGL/ketones every 2 hours
If vomiting stop taking Metformin and SGLT2i’s
NB: Plan may need adjustment if not running a looping pump.
Liquids With Carbs
Fruit juice (10g/100mL)
Tea with sugar (5g/teaspoon)
Milk (5g/100mL)
Liquids Without Carbs
Water
Diet coke/pepsi
Diet cordial
Stock
Tea without milk and sugar
When To Seek Medical Attention
Leon is unconscious
Blood Glucose Levels over 15mmol/L (270mg/dL) and not coming down after two insulin treatments
Ketone levels above 1.5mmol/L (150mg/dL) and not coming down after two insulin treatments
Low BGLs (<4mmol/L (72mg/dL)) even after two hypo treatments
Persistent vomiting (>4 hours) or stained with red/green/yellow
Cannot follow sick day action plan
DKA symptoms
Nausea/Vomiting/Stomach Pain
Increased thirst
Increased urination
Rapid, short breathing
Fruity smelling breath
Drowsy, weak, or confused
Rapid heartrate
Headache
Blurred vision
Dry skin
Note: Leon should not drive if he needs medical attention
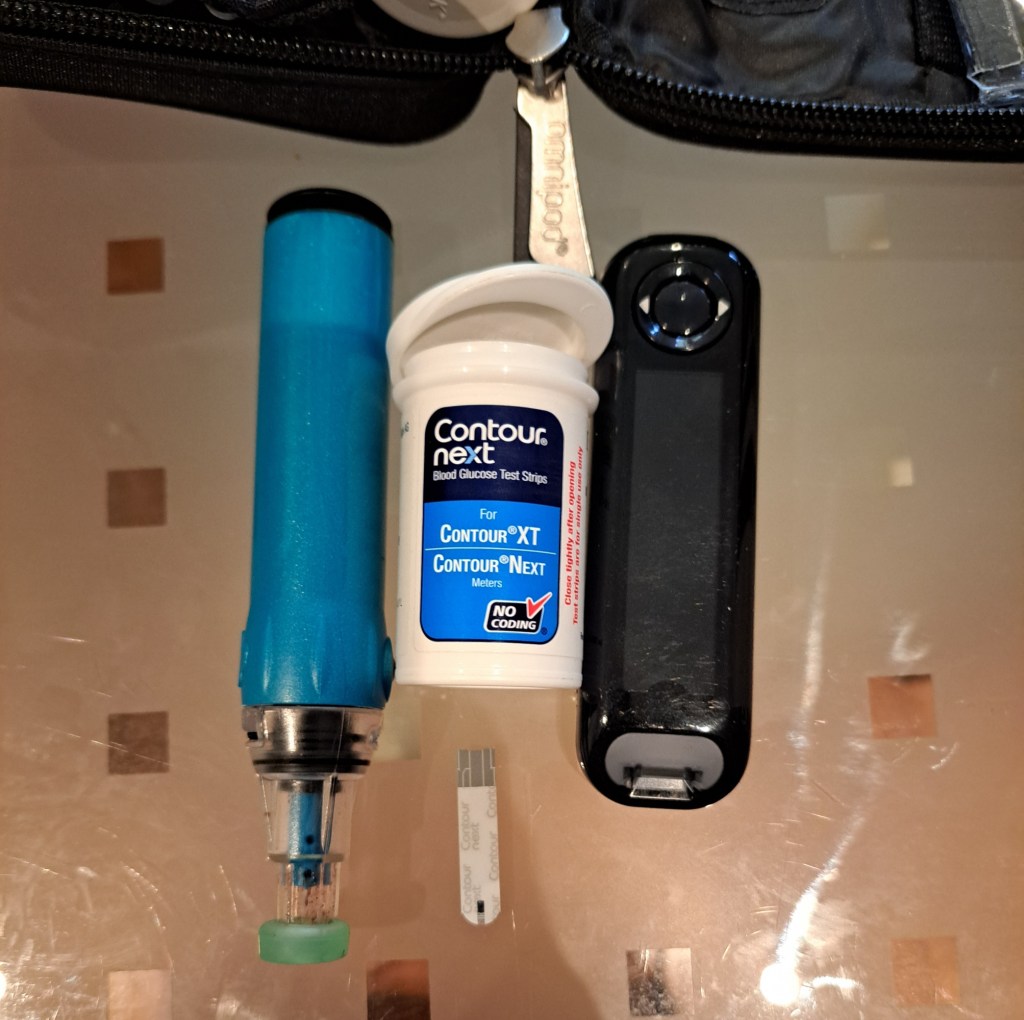
How to Test Blood Sugar Levels
FAMILIARISE YOURSELF WITH THE INSTRUCTIONS BEFORE ACTIONING THEM
Get the black diabetes kit (usually in the blue diabetes bag in the craft cupboard)
Take out the Genteel lancing device, Test Strip container (remove a test strip), and the Glucometer
Place the grey end of the test strip into the glucometer where the slot is
Place the Genteel against a finger tip
Press and hold the black button. You should see blood appear at the site in contact with the fingertip
If you fail to draw blood push the plunger back down until it clicks and try again
Dip the inserted test strip into the blood until the glucometer beeps
Wait a few seconds and it will tell you Leon’s blood glucose level
How to Test for Ketones
FAMILIARISE YOURSELF WITH THE INSTRUCTIONS BEFORE ACTIONING THEM
Get the black diabetes kit (usually in the blue diabetes bag in the craft cupboard)
Take out the Genteel lancing device, a Purple Test Strip in foil, and the Ketone Glucometer
Place the black striped end of the test strip into the glucometer where the slot is
Place the Genteel against a finger tip
Press and hold the black button. You should see blood appear at the site in contact with the fingertip
If you fail to draw blood push the plunger back down until it clicks and try again
Dip the inserted test strip into the blood until the glucometer beeps
Wait 10 seconds and it will tell you Leon’s blood ketone level
How to Give a Glucagon Injection
Only to be done if the blood sugar levels are less than 3mmol/L (52mmol/L) and unresponsive/unable to eat/drink.
NB: I could find no good guidance on when to use glucagon other than ‘when low’ so feel free to adjust the 3mmol/L level to one which works for you and your health care team.
The glucagon kit can be found in the blue diabetes bag in the craft cupboard in the front pouch.
One of the highlight talks for me at ISPAD 2023 was by John Pemberton who spoke on managing exercise when you have type 1 diabetes. This was particularly relevant to me because I have just started cycling again and want to start up a type 1 cycling club in Sydney where I live. He had a wealth of information on exercising safely and, combined with a few other resources I have found, I thought I would consolidate it here for reference.
Given my interest is in the context of a weekly morning cycle for people with type 1 diabetes, the blog will be geared towards this. If this is not what you are looking for, or even if it is, I strongly encourage you to consult an exercise physiologist and your health care team before embarking a change of exercise, especially if you are insulin dependent.
Why is Exercise a Problem for People with Type 1 Diabetes?
The answer is because, in the short term, it makes managing insulin and blood glucose levels harder. For a disease which is already a full-time job for many, making that job harder is not particularly desirable. No one wants overtime for a job that is 24-7. The fear of being in the middle of exercise and having a hypo was consistently mentioned at EASD 2023 and ISPAD 2023 as a psychological blocker for doing more exercise. Dessi Zaharieva summed it up well with this.
While exercise obviously uses up energy, another complication is the increased heart rate makes insulin more effective: this was explained by John Pemberton as being because it accesses more of the body before getting broken down by the liver and kidneys.
So, without smart management we have glucose leaving the blood to feed an exercising body and the tool of choice for doing this, insulin, is now amplified.
On top of this, different exercises affect the body differently. Intense, anaerobic exercise can lead to an increase in blood glucose levels, with the liver dumping glucose into the blood to help the body keep up, while less intense aerobic exercise generally lowers the blood glucose levels.
We can see why hypoglycaemia may be a concern and why people reliant on insulin may consider it all a bit too hard.
Is Exercise Important?
It is hard to find anyone who does not acknowledge the value of exercise to long term health. At every conference there is always an academic who quips that if they could put the health benefits of exercise into a pill, they would win the Nobel prize for Medicine. In the specific case of insulin, exercise lowers insulin resistance and reduces the risk of a variety of diseases. Dessi Zaharieva also put up a great slide at ISPAD 2023 highlighting the benefits.
The World Health Organisation has clear recommendations for exercise which I expect many of us in the Western World spectacularly fail to heed.
While a weekly bike ride is unlikely to tick the WHO box in itself, it is a step in the right direction.
Tools for Exercising Safely
In my opinion, the tool that makes the biggest difference for being able to exercise safely is a Continuous Glucose Monitor (CGM). This tells you what your glucose level is throughout exercising and which direction it is heading, giving you warning if your levels are going too low. In the case of cycling, this means wearing an integrated watch to display the blood glucose level, or having a mounted device, such as a CGM reader or your mobile phone.
If you do not have a CGM, finger pricking can be used. Hypoactive suggests “test your blood glucose (BGL) at least twice, 15-30 minutes apart before you exercise.” This will give an indication of blood glucose level and the direction is it going.
If you are going low during exercise, you will need to treat it, which means having a readily available source of glucose is important when exercising. For cycling, these can be carried in a bike bag/pannier, or in your pocket.
If the worst case scenario does happen, and you go unconscious due to a low, wearing a medi-bracelet also makes a lot of sense so you can receive treatment as quickly and efficiently as possible.
For each of the preparation sections, I will break down the approach into “Food Strategies” and “Insulin Strategies”.
MDI Food Strategy
In the case of MDI, the food strategy is to eat food such that the blood glucose level before exercise is, say, between 7-15 mmol/L (126-270 mg/dL) (taken from My Way Diabetes), providing a buffer for when the exercise brings blood sugar down. Sports Dieticians Australia set a more conservative range of 7-10 mmol/L (126-180 mg/dL) for exercise going over 60 minutes. Diatribe recommends reducing bolus rates by 50% to get there. John Pemberton had a table of suggested foods for the purpose of getting ready for exercise.
The insulin strategy is to reduce the basal insulin leading up to exercise, raising the blood sugar level. Diatribe recommend a 20% reduction in basal rates for exercise of more than 40 minutes. John Pemberton also had some thoughts on this.
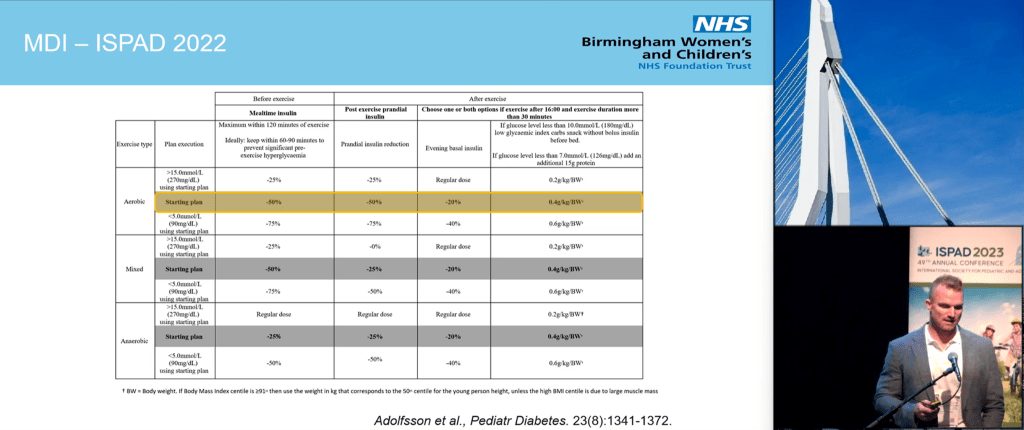
In the case of cycling, this is generally considered an aerobic activity. In the table you begin reducing bolus rates by the amounts for pre- and post-exercise in the “Starting Plan”. If you find you end up too high or too low, you can adjust by moving to the appropriate adjacent plan in the table.
Exercise Preparation: Non-Looping Pump
Pump Food Strategy
The food strategy for pumps is the same as MDI i.e. eat food to temporarily raise blood sugar levels prior to exercise, modifying bolus rates, as needed.
Pump Insulin Strategy
The main difference with the Pump Insulin Strategy to the MDI one is the ability to set temporary basal rates. This gives the ability for some fine adjustment, which is harder with MDI.
Eating food to raise blood sugars does not work with looping because the system automatically raises insulin levels to counter it, regardless of what is declared and bolused for. This means, by the time you are ready to exercise your body has plenty of insulin on board, which the exercise will supercharge, raising your risk of going low. Therefore, the strategy here is, for a morning ride, to skip breakfast.
To use food to raise blood sugars, the loop needs to be deactivated and we can follow the Pump Food Strategy. In my opinion, the better option is to consider the insulin strategy.
Looping Insulin Strategy
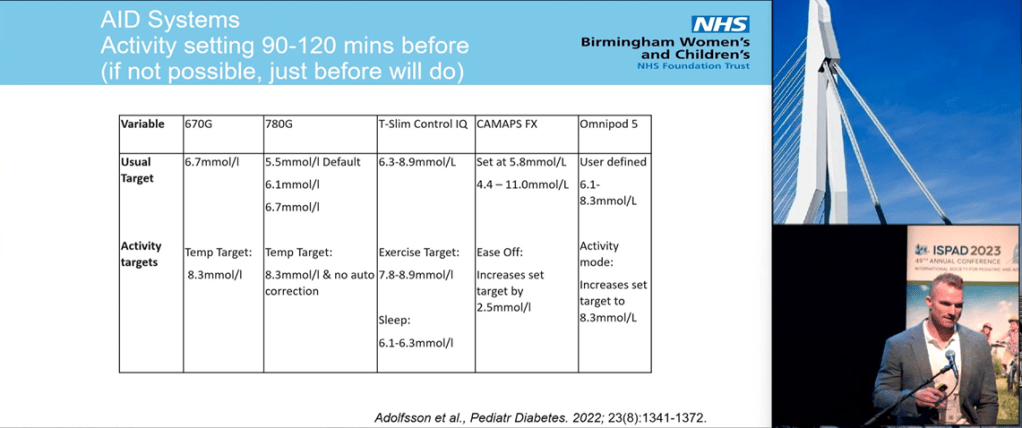
The target blood glucose level can be raised so the loop allows the blood glucose levels to naturally rise. This also minimises the amount of insulin on board (insulin in the body) which, in turn, minimises the risk of a hypo during exercise. Many looping systems also allow the declaration of exercise to modify how aggressive the loop is at reducing blood glucose levels. John had suggestions for most of the commercial looping systems.
Carbs During Exercise
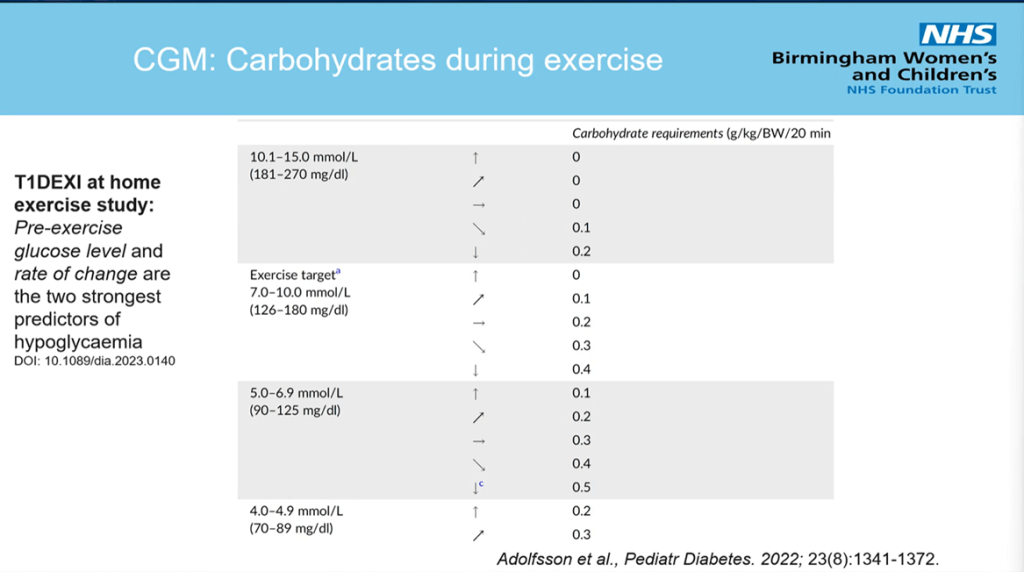
In my opinion this will be different for each person but there are guidelines out there. John Pemberton presented the following to calculate the carbs needed every 20 minutes.
g/kg/BW/20 min will be “grams of carbohydrate per kilogram of bodyweight to be taken every 20 minutes”. So, for example, if someone is 80kgs and their CGM level of direction suggests 0.2 g/kg/BW/20 min, this would mean 0.2*80g = 16g of carb every 20 minutes.
Sports Dieticians Australia suggest carbs are only needed every 60 minutes with aerobic exercise but do not go into details on the amounts.
Diatribe recommend for people on insulin pump therapy, to reduce the basal rate by about 50% (as a starting point) 1-2 hours before, during, and about one hour after exercise.
My thought is carry carbs with you and as soon as you see your glucose dropping, eat some. Examples of potential exercise raising food are above in the Carbohydrates: Just Before and During Exercise. Once you get a feel for your body’s carb cadence, you can get some carbs in ahead of the drop. Based on my own experience, as your body adapts to exercise and become more efficient, this cadence will change.
Post Exercise Tips
Hypoactive suggests monitoring glucose levels for at least 24 hours after exercise. The reason for this is muscles store glycogen which is consumed during exercise. To replenish glycogen stocks, glucose is taken out of the blood, increasing the risk of a hypo.
Diatribe recommend reducing bolus insulin by 50% for meals or snacks up to two hours after exercise.
My Strategy
For my weekly ride, as I am using a closed loop, I do not eat breakfast. While I initially set a higher target on my loop, I found it did not have much of an effect so I have stopped this. The one act which has made a huge difference in my blood glucose levels is eating a protein bar literally just before I ride. This act keeps my blood glucose levels flat for up to an hour.
Here is an example from literally this morning.
The rise just after 9am is the post-ride flat white coffee. While it always sends me up, this is my insurance policy for the car ride home again post-exercise lows. As we can see, my levels did drop into the high 3’s but, I have been this low before; this was happening to me even before I became insulin dependent so unless it goes below, say, 3.5 mmol/L (63 mg/dL) I do not give it too much attention.
Bringing It All Together For A Morning Ride
I will end this blog with a sample approach/preparation for an early morning cycle ride of, say, one hour.
Equipment
Functioning CGM
Mountable CGM reader or compatible watch
Rapid-acting hypo snacks for mid-exercise lows
Medi-bracelet
Sunscreen
Low GI snacks for maintaining healthy glucose levels during exercise
Glucose Levels
MDI: Low GI breakfast to raise glucose levels prior to exercise with a reduced bolus to minimise insulin on board AND/OR reduce basal rates to allow blood glucose levels to rise
Pump: Low GI breakfast to raise glucose levels prior to exercise with a reduced bolus to minimise insulin on board AND/OR set temporary basal rates to allow blood glucose levels to rise
Looping: Skip breakfast, set a higher loop target OR disable looping and follow the Pump approach
During the Ride
Monitor glucose levels and, if they are dropping, eat a snack to counteract the trend
If you already know how long you can exercise before levels start to drop, eat snacks accordingly
After the Ride
Monitor blood glucose levels
Reduce bolus rates by 50% up to two hours are the ride
Make any necessary adjustments to the approach for the following week.
Michelle Law has an excellent blog over at Pumps and Pricks. One thing she does is a ‘Top Ten’ of the conferences she attends. This year, like me, she attended EASD 2023, thanks to Dedoc, and posted her Top Ten Highlights. I have purposely not read it because this blog will do the same for EASD 2023 and ISPAD 2023. It will be interesting to see the areas of research that spoke to both of us and our different takes on them. The ranking of ten to one is not important; they are all interesting announcements/areas fo research.
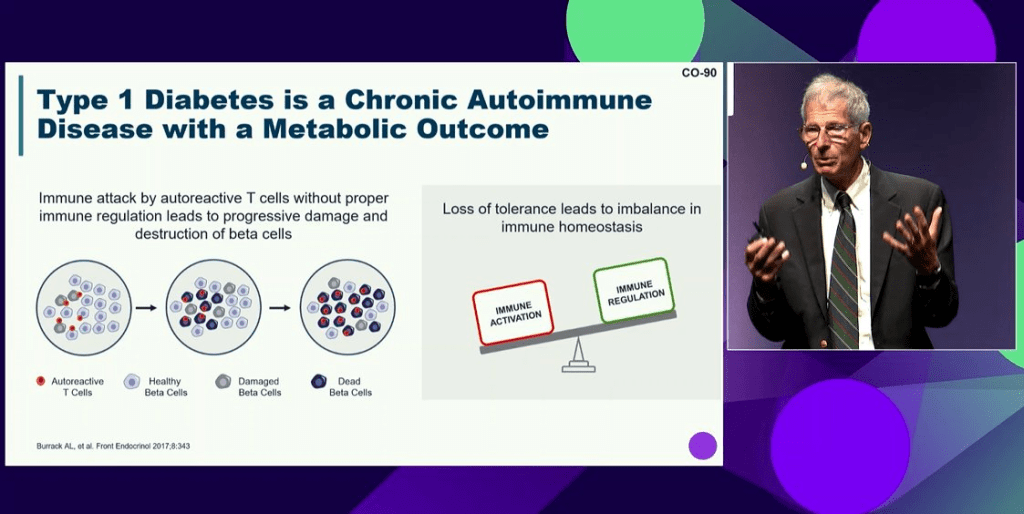
10. Type 1 Diabetes Before Insulin
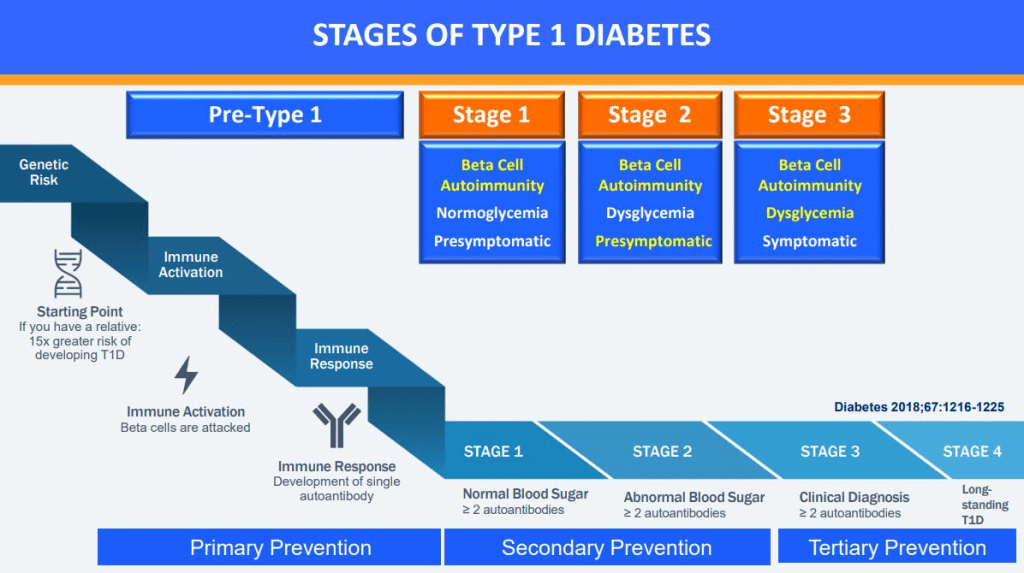
With drugs like Teplizumab which can delay the progression of type 1 diabetes, research is now focusing on the disease before the person becomes insulin dependent. These days there are four stages for type 1 diabetes with insulin only being needed in the third stage.
How do we know someone is likely to develop stage 3 type 1 diabetes? Because of the auto-antibodies in their blood which appear years before insulin is needed.
To shift this paradigm of type 1 diabetes being ‘insulin-dependent diabetes’, Kevan Herold described type 1 diabetes as an autoimmune disease with a metabolic outcome i.e. the beta cells stop working.
Flemming Pociot spoke of the limitations of just relying on auto-immune markers for early detection and how improved detection could be achieved by looking at genetic information and lipid profiles (FDR = First Degree Relative e.g. parent).
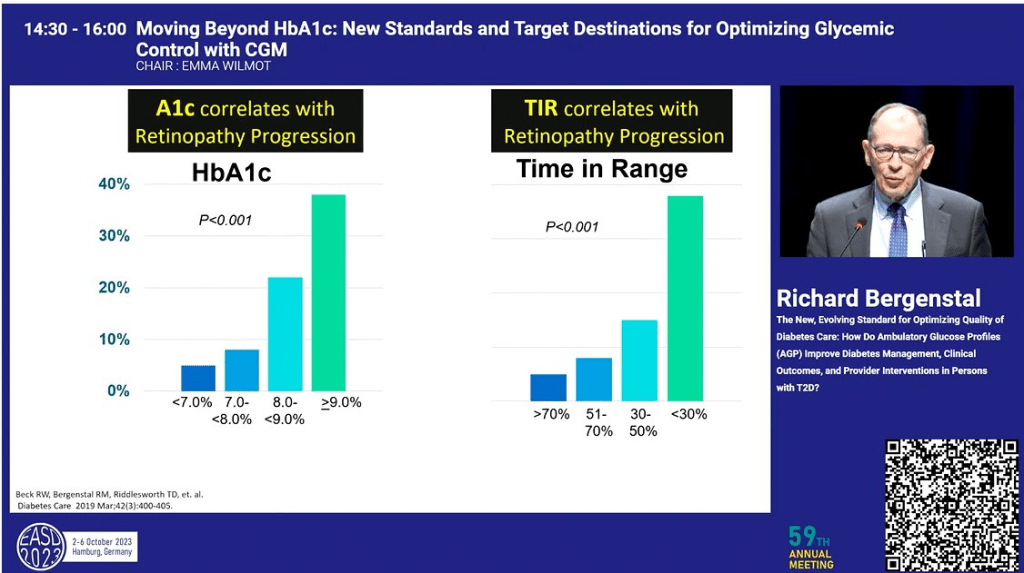
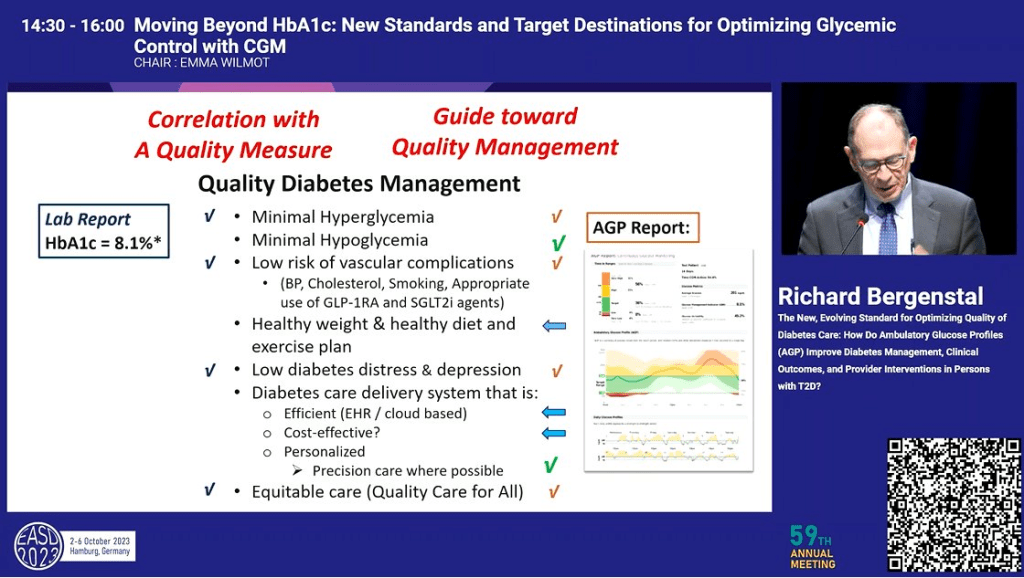
9. Time in Range is the New HbA1c
While there are plenty of people in the world without access to Continuous Glucose Monitors (CGMs), the people of Europe are generally not those people. So, it makes sense that the conferences focused a lot more on Time in Range (TIR) than on HbA1c.
Richard Bergenstal showed that, from a research perspective, TIR is as predictive as HbA1c
and provides a wealth of information an HbA1c measure does not, providing better guidance for the management plan for the disease.
Throughout the two conferences, as touched on below, many of the outcomes were focussed on Time in Rage, Time Above/Below range rather than HbA1c.
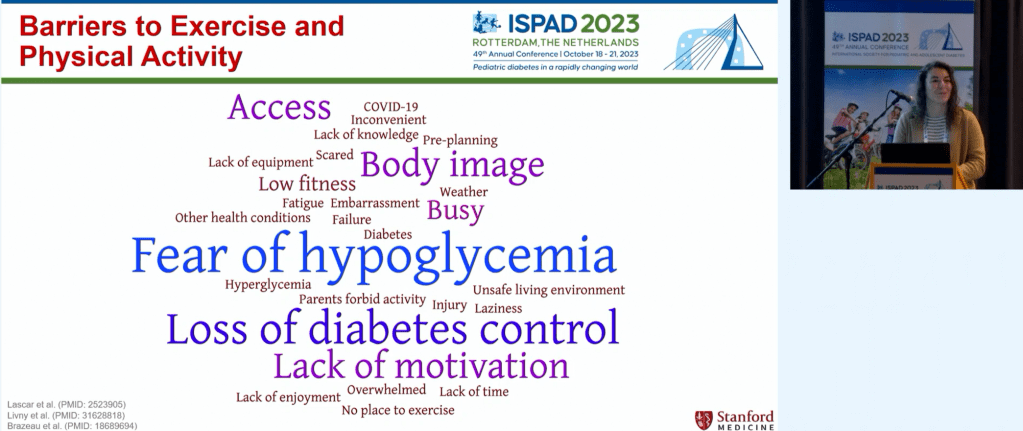
8. Exercise and Diabetes
There was a lot of talk about exercise at the conferences. Dessi Zaharieva spoke of the known benefits of exercise for people with diabetes.
and the barriers people with type 1 diabetes often face when considering exercise.
John Pemberton showed a post-meal walk can have a significant, positive impact on glucose levels.
Jennifer Leohr showed Lyumjev (URLi) worked better with exercise than Humalog (Lispro) inducing less hypos.
7. Looping/Automated Insulin Delivery (AID)
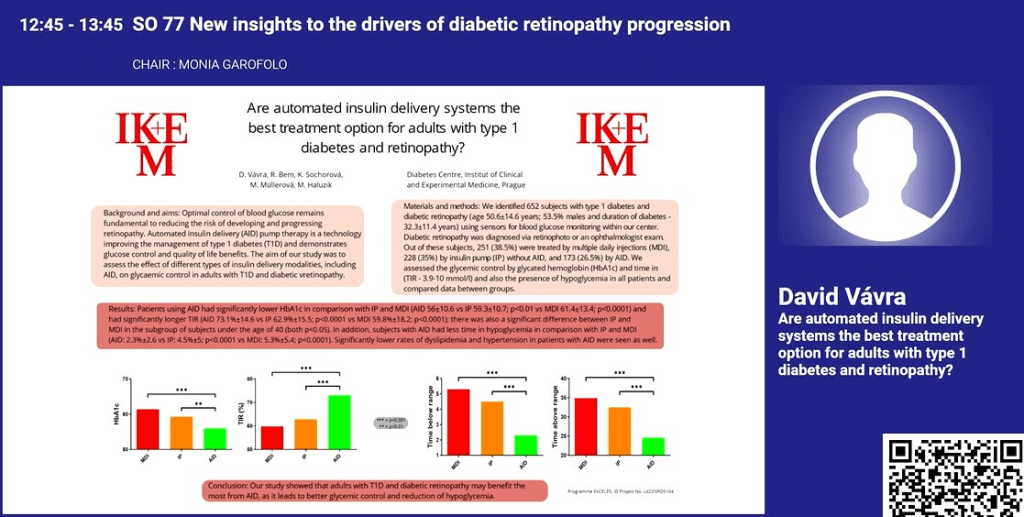
As we have seen in previous conferences, Looping systems (AID) showed superior performance to insulin pumps (IP) and multiple daily injections (MDI).
David Vavra showed similar results for HbA1c as well as other measures.
Javier Castaneda showed how 82% of those using the recommended settings on the commercial Minimed looping system achieve a Time in Tight Range (TITR) of over 50% which is, according to Thomas Danne, is sufficient to avoid long-term complications.
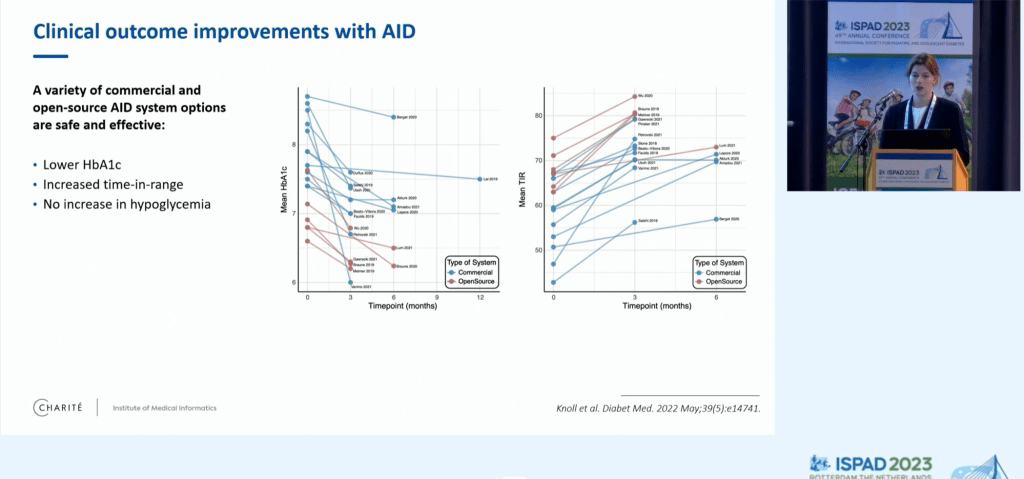
Comparing open-source looping systems to the commercial ones, Ludek Horvath found the open-source system yielded superior results but this could be a function of the people using them rather than any inherent advantage.
He also showed that looping systems achieve greater than 70% time in range which is significantly larger, and more consistent across countries, than the use of non-looping pumps or injections.
Katarina Braune also confirmed that open-source systems are at least as good as the commercial ones.
Yves Reznik talked about a study looking at people with type 2 diabetes, insulin dependent, but unable to give themselves injections. Moving to a looping system significantly improved their blood glucose levels.
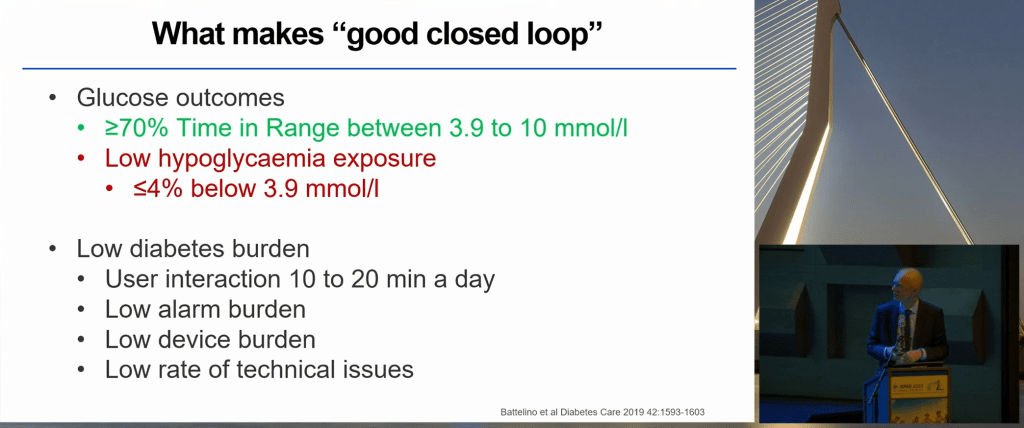
At ISPAD, Roman Hovorka spoke of what is desirable in a looping system and confirmed “The right system is the one people are willing to use”.
There was also increased talk of ‘fully closed looping’ i.e. no manual bolusing or declaration of meals which I had not seen much of in previous conferences. Sarah Koning looked at how many grams of carbohydrate a loop can tolerate in a meal without announcements. The answer is somewhere between 0-60 and at least 20g. While meals of 61-80g led to less Time in Range (TIR) and Time Above Range (TAR) with fully closed looping, there was no increase in hypos or DKAs.
Lenka Drnkova (Petruzelkova) showed that a fully closed open-source loop performs as well as the same system with manual boluses or no-bolus meal declarations. There are still some kinks to work out though e.g. exercise.
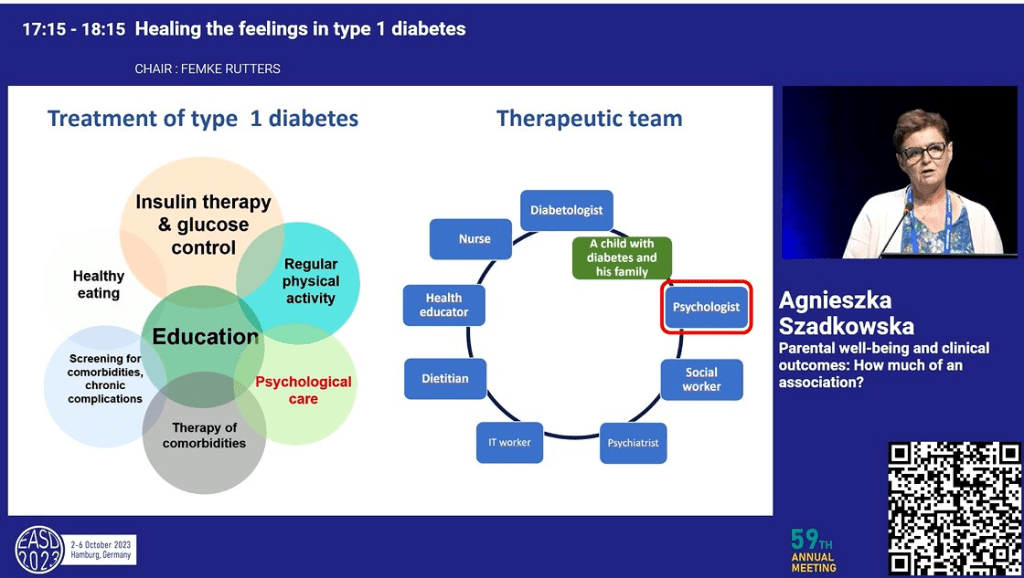
6. A Psychologist as Part of the Diabetes Health Care Team
There was a lot of talk of a mental health specialist being part of the person with diabetes’ health care team. Agnieszka Szadkowska summed it up nicely in this slide where the psychologist is on equal footing with the rest of the therapeutic team.
Evelyn Cox presented preliminary findings linking mental health management with better clinical outcomes e.g. HbA1c and Time in Range.
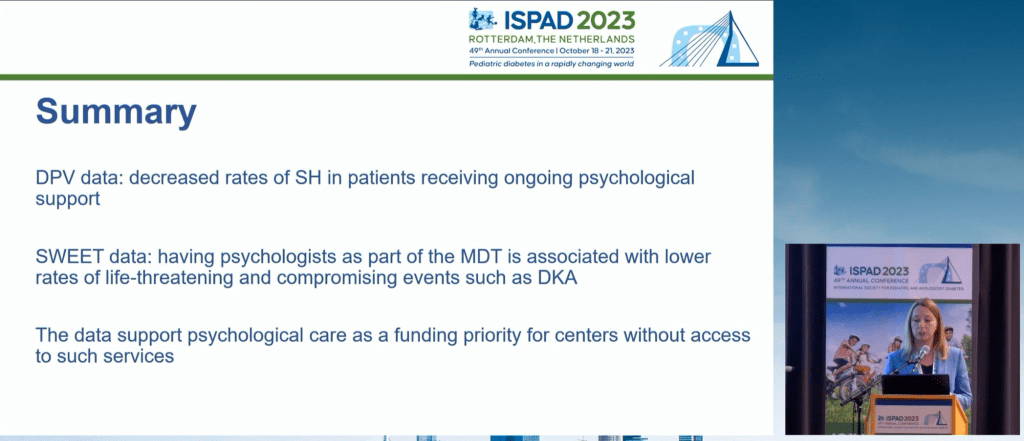
Agata Chobot linked on-going psychological support for people with type 1 diabetes with improvement in severe hypoglycemia and DKA rates.
5. End Diabetes Stigma
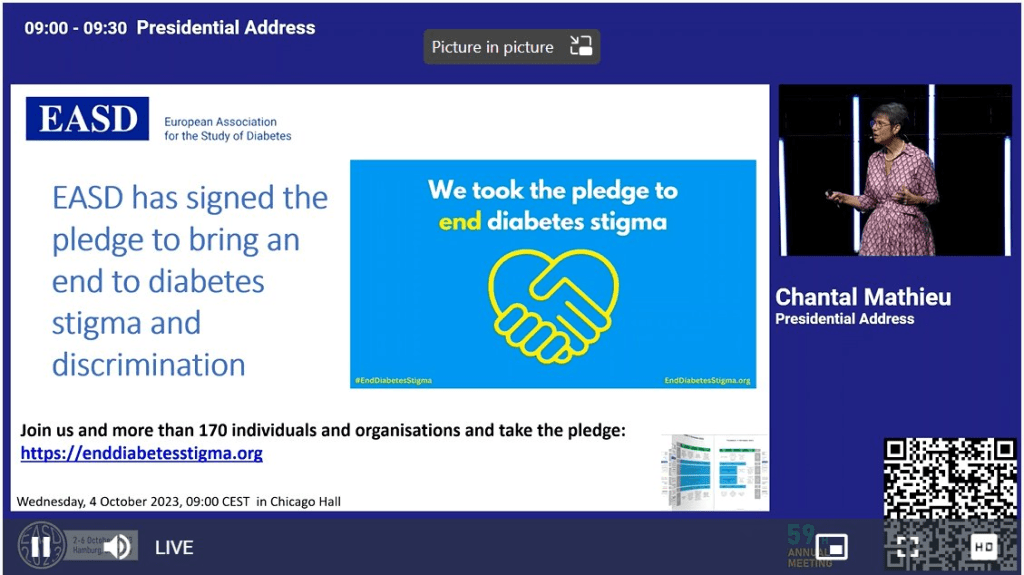
The recognition of the end diabetes stigma campaign was throughout EASD 2023, starting out with the presidential address.
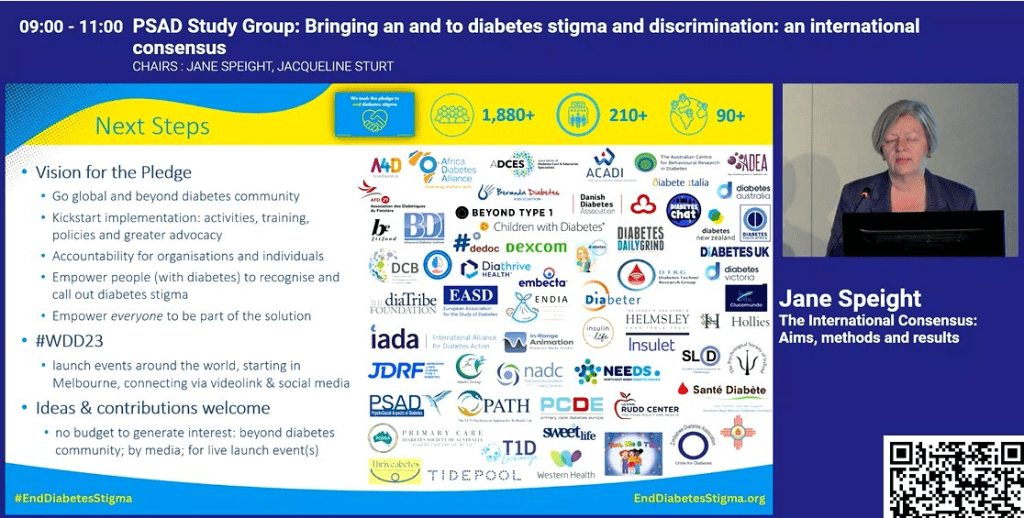
Jane Speight talked about those behind the campaign, how the pledge was created
and expanded on how many individuals and organisations had signed, and the reach of the campaign so far.
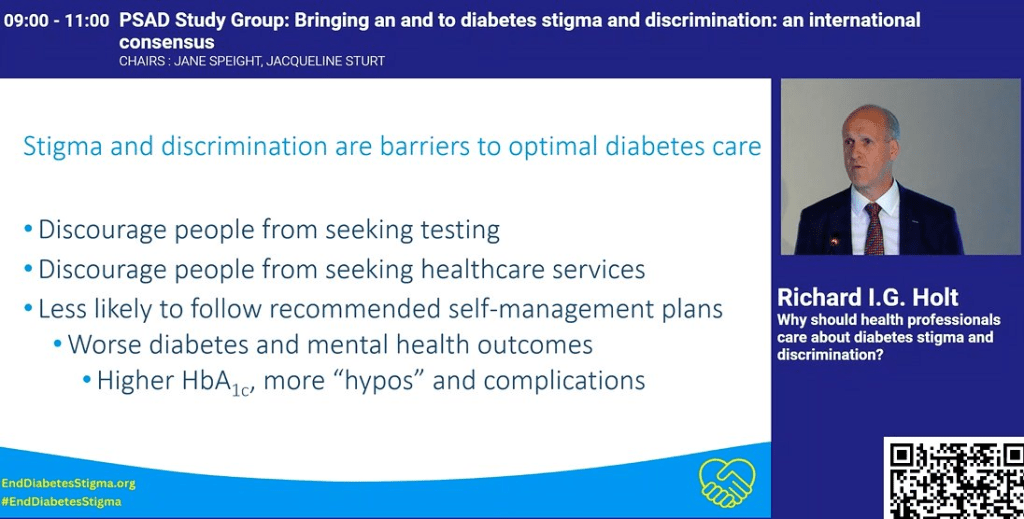
Richard I. G. Holt provided examples of how healthcare professional can be unwittingly part of the problem
and how stigma hinders optimal care.
4. Dual/Triple Agonists
Incretin Mimetics such as Ozempic/Wegovy have been big news for a while because, as well as being an excellent medication for type 2 diabetes, can result in weight loss. The next generation of these drugs are now coming to market and, while drugs like Ozempic target one type of receptor in the body, these new versions target 2 or more.
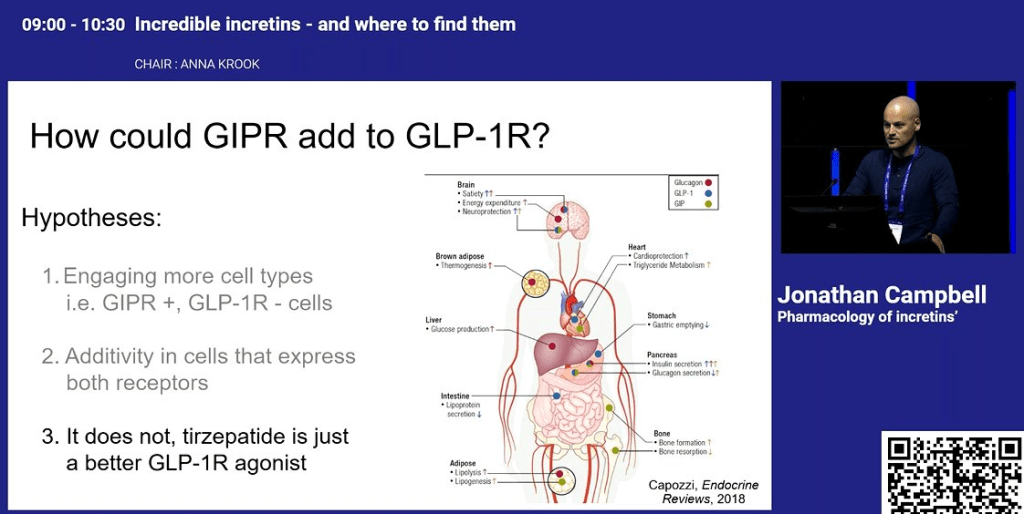
Jonathan Campbell talked about how dual agonists such as Tirzepatide work and, while they know what they do, how they do it is not as clear.
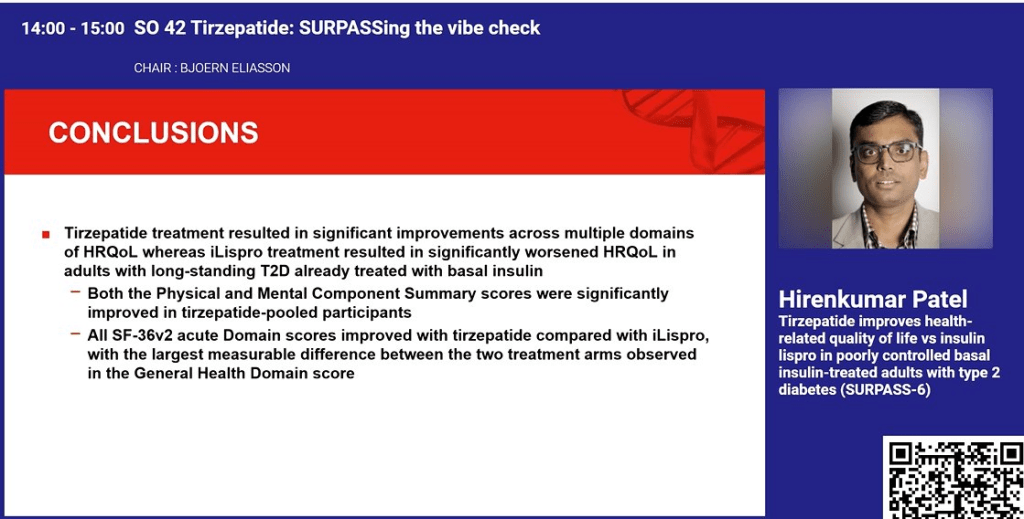
Hirenkumar Patel showed that, for people with type 2 diabetes, the use of Tirzepatide gave better results, both qualitatively and quantitatively, than basal insulin injections.
Eda Cengiz spoke of new research in a triple agonist which led to a 2% drop in HbA1c.
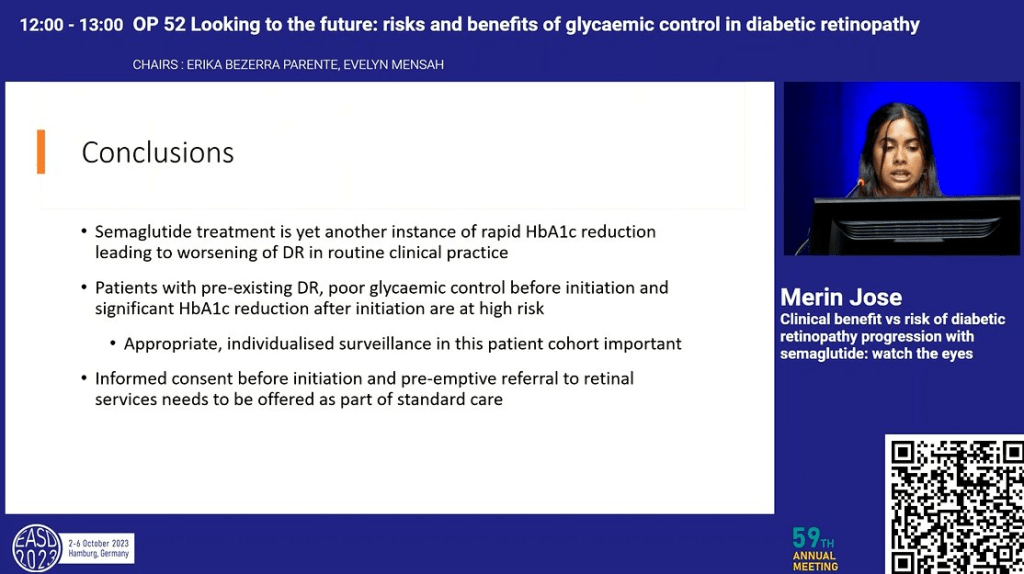
Merin Jose gave a word of warning that the rapid reduction in HbA1c resulting from these drugs can increase of the risk of diabetic retinopathy and this should be monitored closely.
3. Sleep and Diabetes
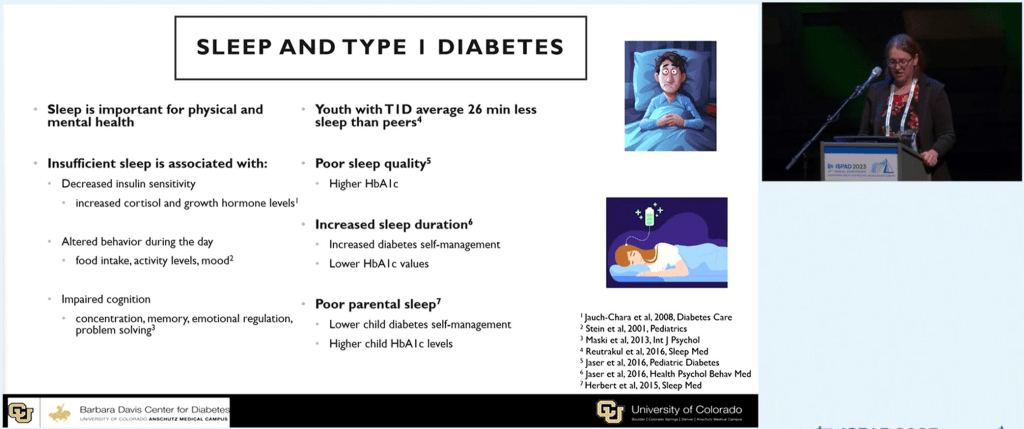
The benefits of sleep for people with diabetes came up during the conferences. Natalia Marhefkova showed how good sleep patterns directly affect outcomes e.g. a lower HbA1c. When asked by the audience what the ideal amount of sleep was, Natalia claimed it was 7-8 hours.
Erin Cobry also touched on the benefits of sleep for people with type 1 diabetes.
She also went on to talk about how Looping (AID) facilitates uninterrupted sleep and how even the interrupted sleep of carers can affect the clinical outcomes of the child they care for.
2. Diabetes and Diet
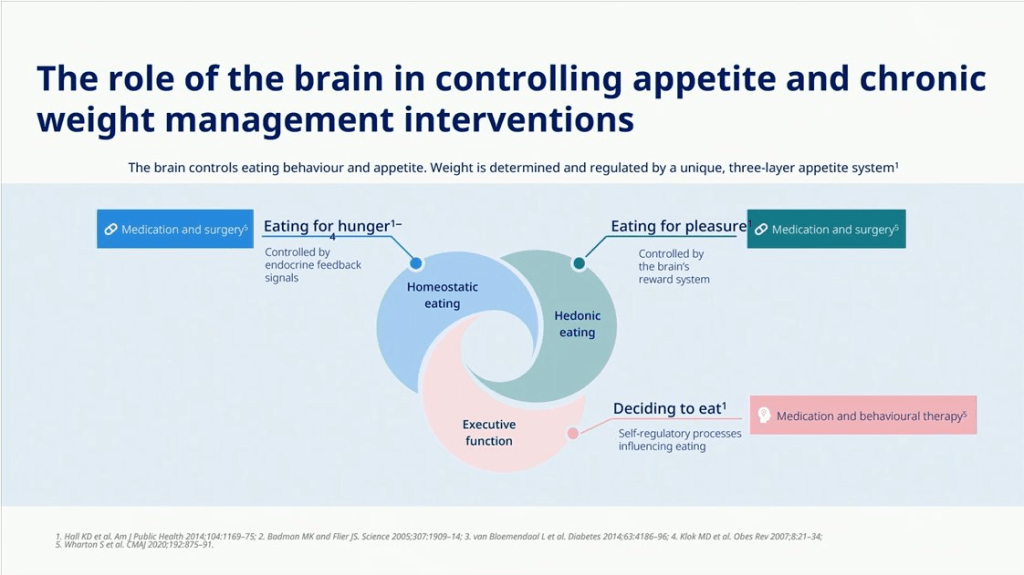
Jens Aberle talked about how if we plan to help manage the diet of people with diabetes, we need to better understand the reasons people are eating.
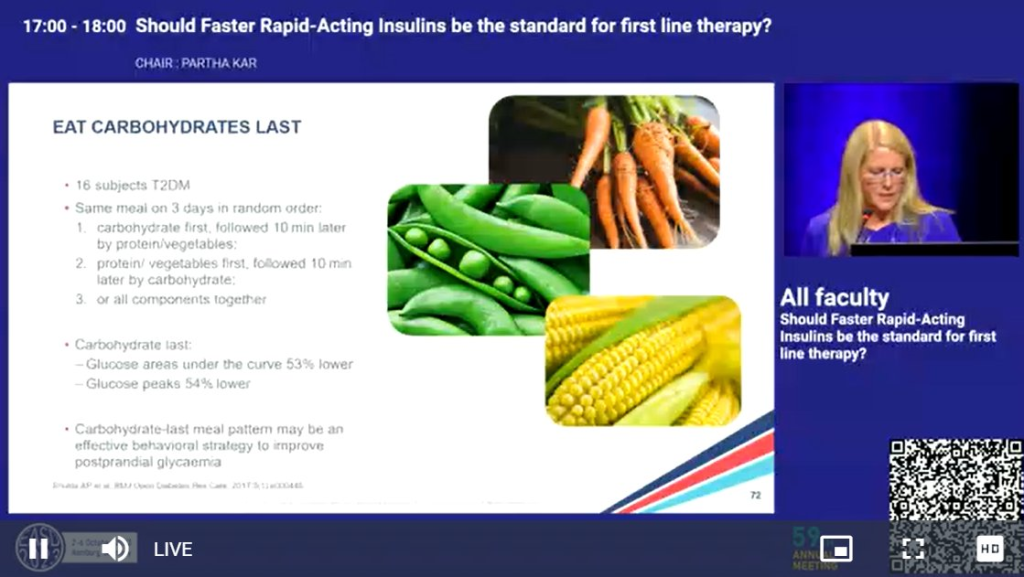
Emma Wilmot talked of a study which had confirmed that eating the carbohydrate foods last in a meal can have a significant impact on glucose peaks.
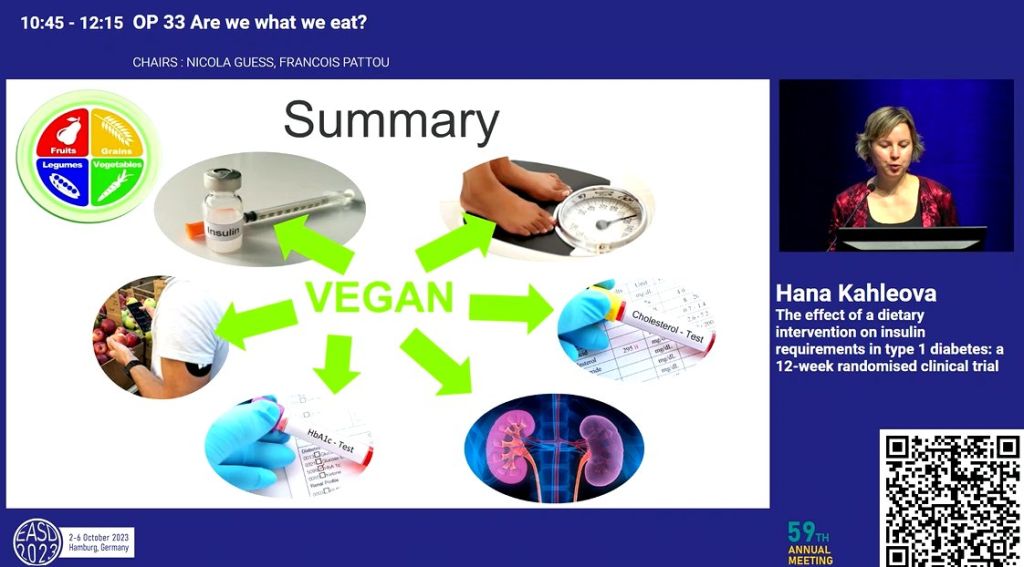
Hana Kahleova presented a study comparing a vegan diet to the ‘healthy plate’ and found while the healthy plate provided benefit in Hba1c and cholesterol, the vegan diet saw benefit in these and other measures such as daily insulin need, which was reduced, despite an increase in carbohydrate in-take.
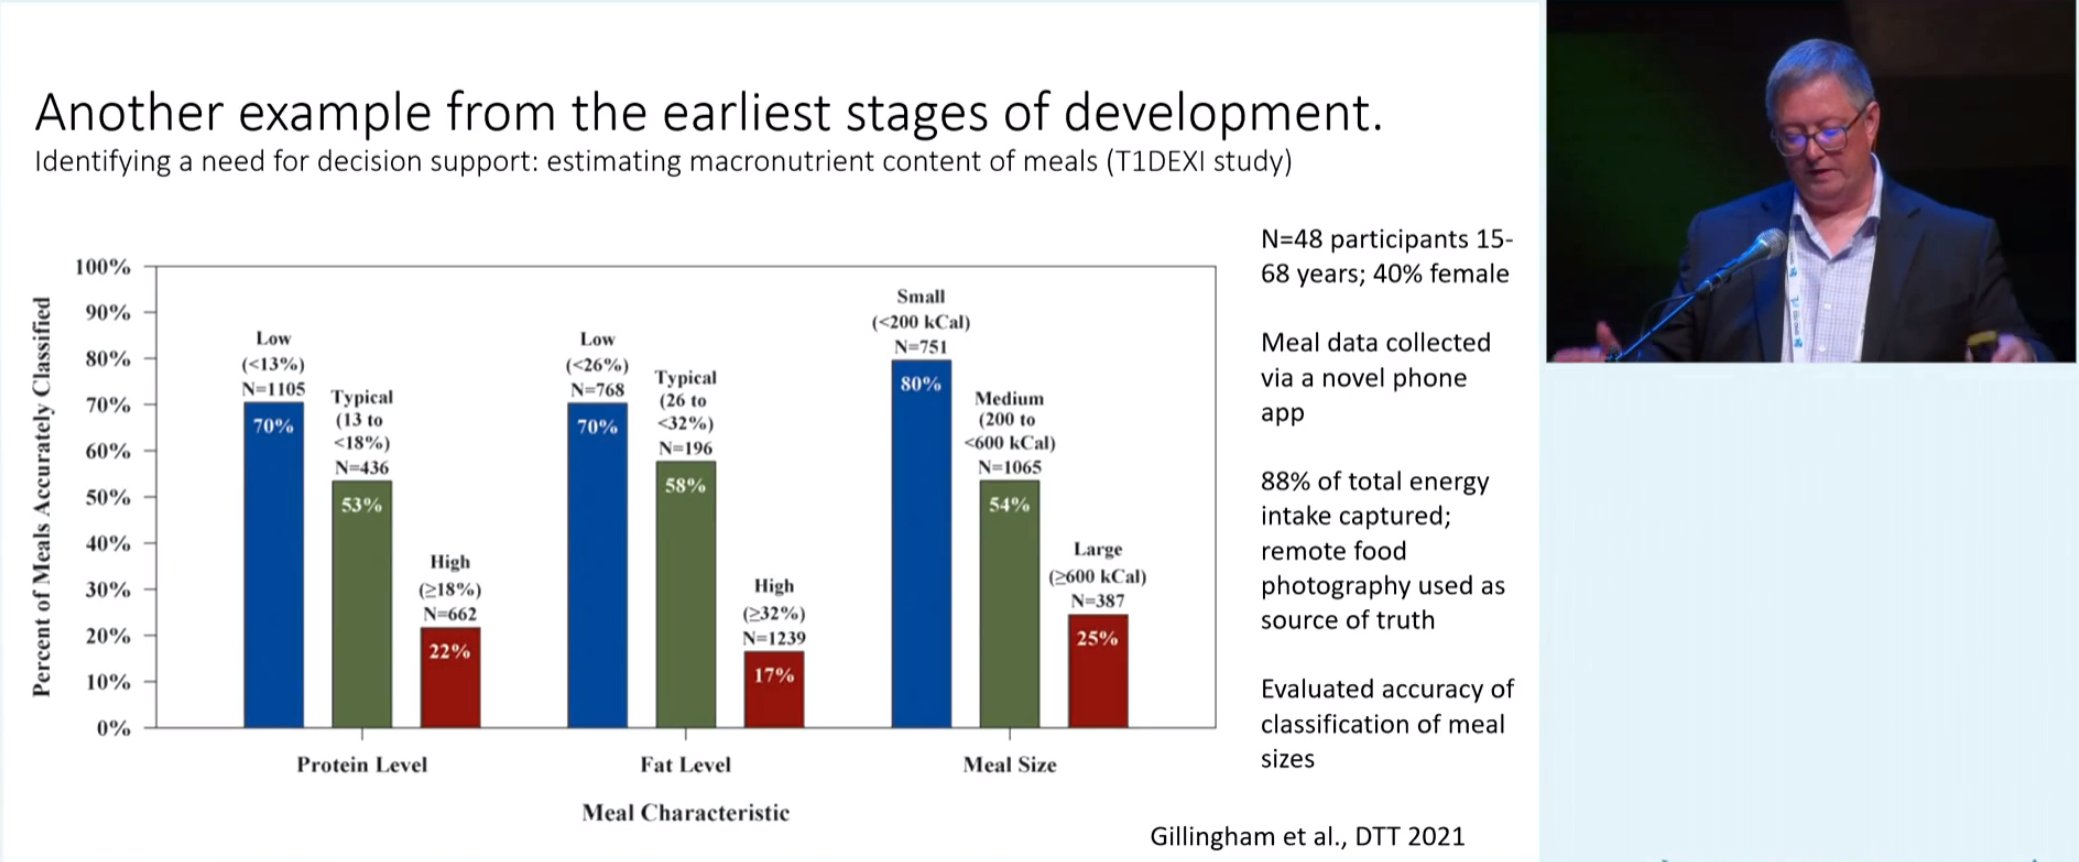
Mark Clements talked about how smaller meals are easier to estimate for their carbohydrate content than larger ones
and how people with diabetes tend to underestimate the carbohydrate content of larger meals.
1. SGLT2is
This class of drugs lowers the threshold at which the body redirects blood glucose to the bladder. Aikaterini Eleftheriadou spoke of the benefits of SGLT2is compared to incretin mimetics in regard to long term complications.
Aino Latva-Rasku showed SGLT2is increase skeletal muscle and brain uptake in fatty acids in people with type 2 diabetes. One explanation is SGLT2is change the body’s preference for fuel source.
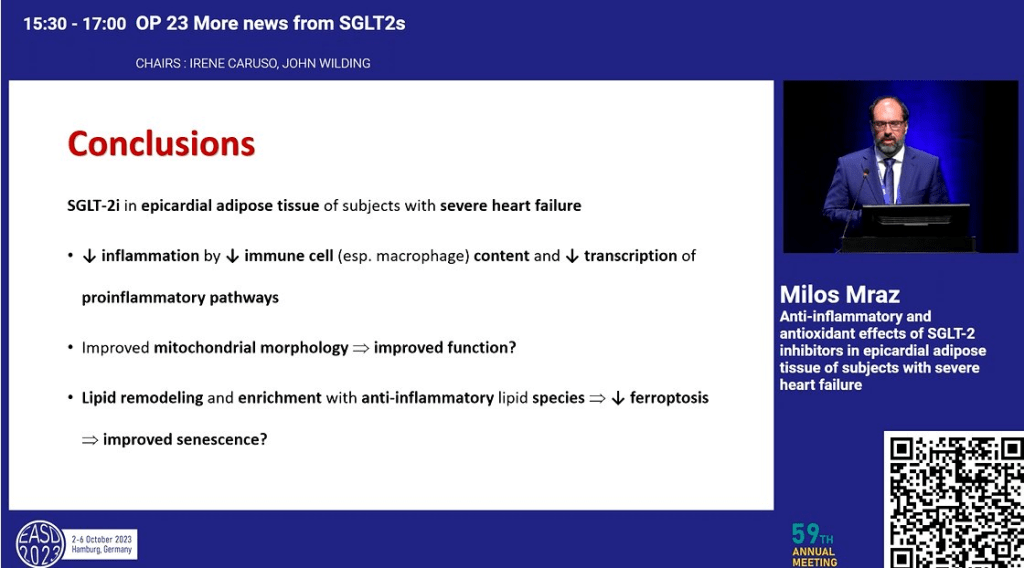
Milos Mraz spoke of the anti-inflammatory benefits for Type 1 Diabetes and while the blood glucose redirection mechanisms are understood, the other effects observed are not quite yet understood, similar to incretins.
Conclusions
My final thoughts (thanks Michelle) are:
(10) Type 1 Diabetes Before Insulin: The expansion of type 1 diabetes to consider the time ‘before insulin’ e.g. Stage 1 and 2 is really interesting. I wonder if this will lead to reclassification of LADA as simply a slow progressing form of Stage 2, Type 1 Diabetes.
The progress of early intervention type 1 drugs, such as Teplizumab, is really exciting and, hopefully will lead to a cure. One presentation spoke of using a combination of drugs whose effect for slowing progression will be additive and potentially ‘cure’ someone of type 1 diabetes, with the person taking pills rather than injections. While it has been promised for decades, with looping technology and immune system modifying drugs, we are genuinely getting closer to a practical cure.
(9) Time in Range is the New HbA1c: There is clearly an increased interest in using Time in Range (TIR) in academia, instead of the traditional HbA1c. My speculation as to “why?” is because it allows multiple secondary endpoints (additional measures) off of the same data whereas there is only so much you can do with an HbA1c measure. Unfortunately, bodies like the FDA who approve medications and diabetes technology still emphasize the value of HbA1c over TIR. This means for research to be useful to the manufacturers of the medications and technology, who also, in part, fund the research, HbA1c often needs to be the primary measure. Hopefully, in time, bodies like the FDA will see the value of TIR as a ‘primary endpoint’ in research.
(8) Exercise and Diabetes: There is increasing research into how to incorporate exercise into the lives of people with type 1 diabetes while allaying fears of hypoglycemia. This is great and can only be a good thing for diabetes management. For years I avoided exercise because of the concern of the effect it may have on short term blood glucose levels. Using the research, I am seeing at these conferences, I am now putting together a program for myself, and hopefully others with type 1 diabetes, which will help them introduce exercise into their lives safely.
(7) Looping/Automated Insulin Delivery (AID): Looping goes from strength to strength and there is a genuine belief in the looping research community that we are close to a fully closed loop. From my own experience I know of how looping reduces the burden of diabetes management significantly. While not a cure per se, looping makes mental room for other aspects of life and, for many, will bring precious relief from the constant harassment of management.
(6) A Psychologist as Part of the Diabetes Health Care Team: The rise in prominence of a psychologist on the health care team is well overdue and I look forward to this academic acknowledgement move to government policy and subsidised consults. While not disputed, the mental burden of diabetes management is rarely openly acknowledged. Access to psychological services, as a given for diabetes management, would be a huge step in this regard.
(5) End Diabetes Stigma: The rapid rise of the End Diabetes Stigma campaign is interesting. I have signed the petition and I hope it leads to something tangible for people with diabetes. People hide the fact they have diabetes and do not seek the help they need out of misplaced shame and embarrassment. This, in turn, leads to poor outcomes. In this sense ending diabetes stigma will save lives and improve the quality of life for many.
(4) Dual/Triple Agonists: This class of drugs is providing substantial benefit to people with diabetes, and I have spoken of these benefits in the past. In moving to double and triple agonists we are seeing an amplification of the effect and benefits and, while we do not completely understand the mechanisms in play, the promise of these drugs is significant.
(3) Sleep and Diabetes: For type 1 diabetes, interrupted sleep was often inevitable because of highs and lows, or because of split basal dosing. In the case of carers, the monitoring of the child with diabetes through the night also guaranteed broken sleep. Automated alarms and looping open the door for a complete night’s sleep for all. For myself, thanks to looping, a broken sleep because of diabetes may happen once a month but little more. Now I just need to work on getting the 7-8 hours sleep a night suggested to be optimal…
(2) Diabetes and Diet: While social media is awash in food hacks for people with diabetes, it is still good to have research-backed evidence on what is proven effective. Whether it is considering the psychological aspects of eating, or the practicality of estimating carbohydrates in a large meal, all of this informs people with diabetes on the best approach for them which has the best probability of success.
(1) SGLT2is: While there is still work to go on making these generally available for people with type 1 diabetes, due to factors such as the increased risk of DKA and eDKA, it is clear there are tremendous benefits in using them. I use a low dose SGLT2i at the moment, in combination with exercise once per week, and have seen a literally halving in my daily insulin needs and, without altering my diet, rarely see excursions beyond 8 mmol/L (144 mg/dL).
Thank you again to Dedoc for making it possible for me to attend these conferences and I strongly recommend, if you are an advocate who can #PayItForward to your community, applying for a Dedoc scholarship to attend a conference in 2024.