This is going to be an interesting week. My Omnipod subscription is about to run out and I am getting an Ypsopump at the end of the week. I love Omnipod but, as it is completely unsubsidized/insured in Australia, my hip pocket dictates I need to move to something else. This means I will be moving from AndroidAPS to CamAPS and, in the intervening days, I am going to run AndroidAPS with MDI to see what that looks like.
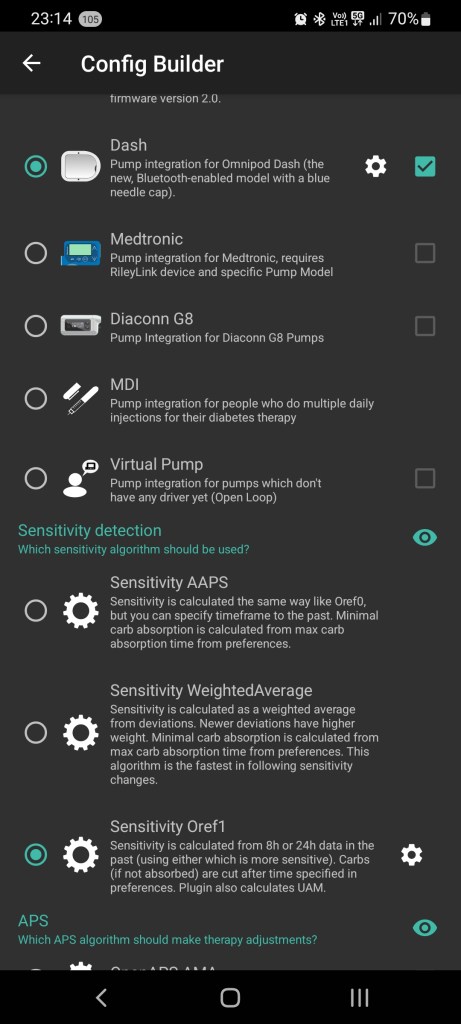
I assume it means the looping engine will give me recommendations for injections, rather than automatically applying them.
I am going to miss AndroidAPS as it has been excellent. With my settings tuned, the loop was completely closed; I did not declare meals and yet I still maintained an HbA1c of 6.0% and a Time in Range of around 90%. I avoid overly carby food but I am far from a low carb regimen. A completely closed loop will not be possible with CamAPS but I do hear it is excellent.
Before I leave AndroidAPS though I thought I would document how I tuned my settings in case others were looking to do so and so, when I return to AndroidAPS, I will have this as a reminder of what I did.
Tuning So Far
In a couple of previous blogs, I talked about how I found things like my basal rate, and pump settings through finger pricking and CGM use. Here I use the full power of AndroidAPS and Nightscout to analyse my CGM data across multiple days for a much more accurate result. Before I launch into my method, I should explain what AndroidAPS and Nightscout are.
AndroidAPS is an open source looping system adapted from OpenAPS and made specifically for Android phones. I spoke about it previous here in my tech/CRM blog.
Nightscout is, effectively, an online website with your CGM data in it. I have been running it for years now and, if you are wanting more information on it and how to set it up, you can find it here. As well as showing CGM data, AndroidAPS can also push up data from AndroidAPS. For me it was a great way to have all of my data online so I could do things like access it via Zapier or Power Automate. In fact there is a lot you can do with the Nightscout data. I previously mentioned how I use it to generate reports for my endocrinologist. It turns out you can also use to to tune your pump settings via Autotune.
Autotune
The easiest way to access Autotune is via Mark Carrington’s online interface at https://autotuneweb.azurewebsites.net/.
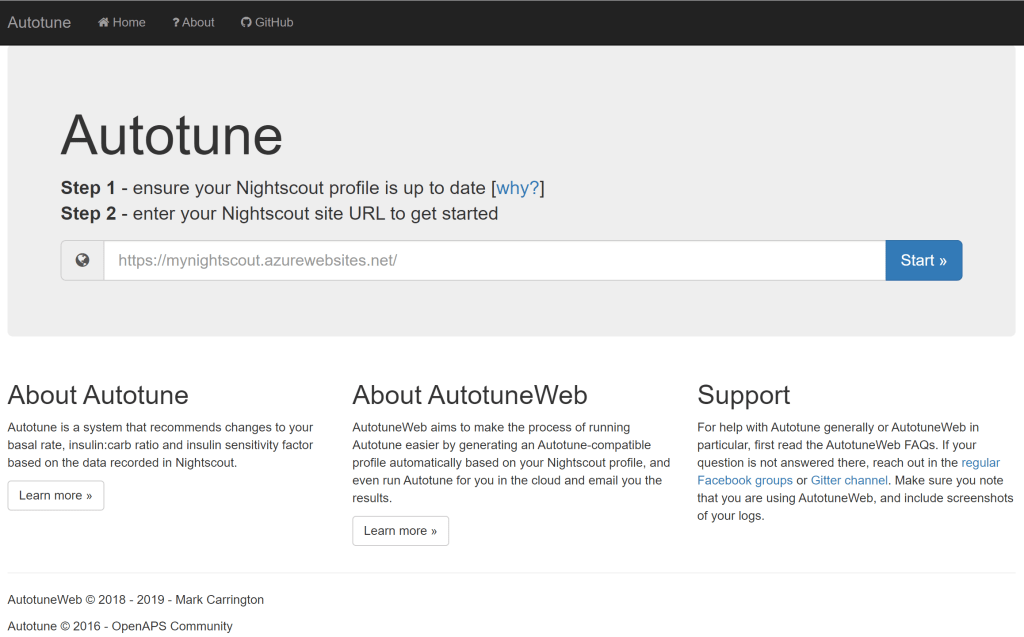
Here we put in our Nightscout URL and tune the values of interest.
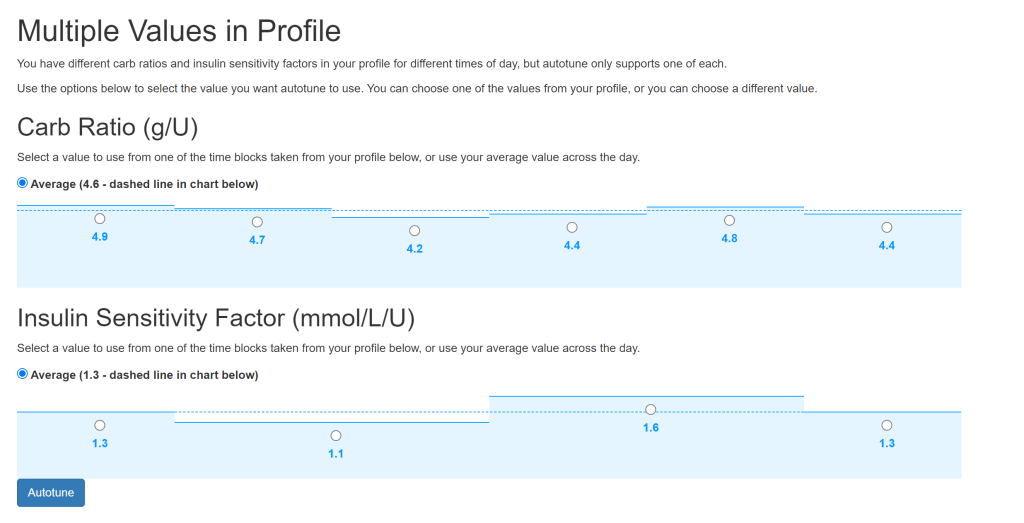
In my basal profile I have six values covering four hours each so I often run Autotune six times to cover each time period.
The result is a set of recommendations for the basal rate per hour, the value for the Insulin-Carb ratio and the Insulin Sensitivity Factor.
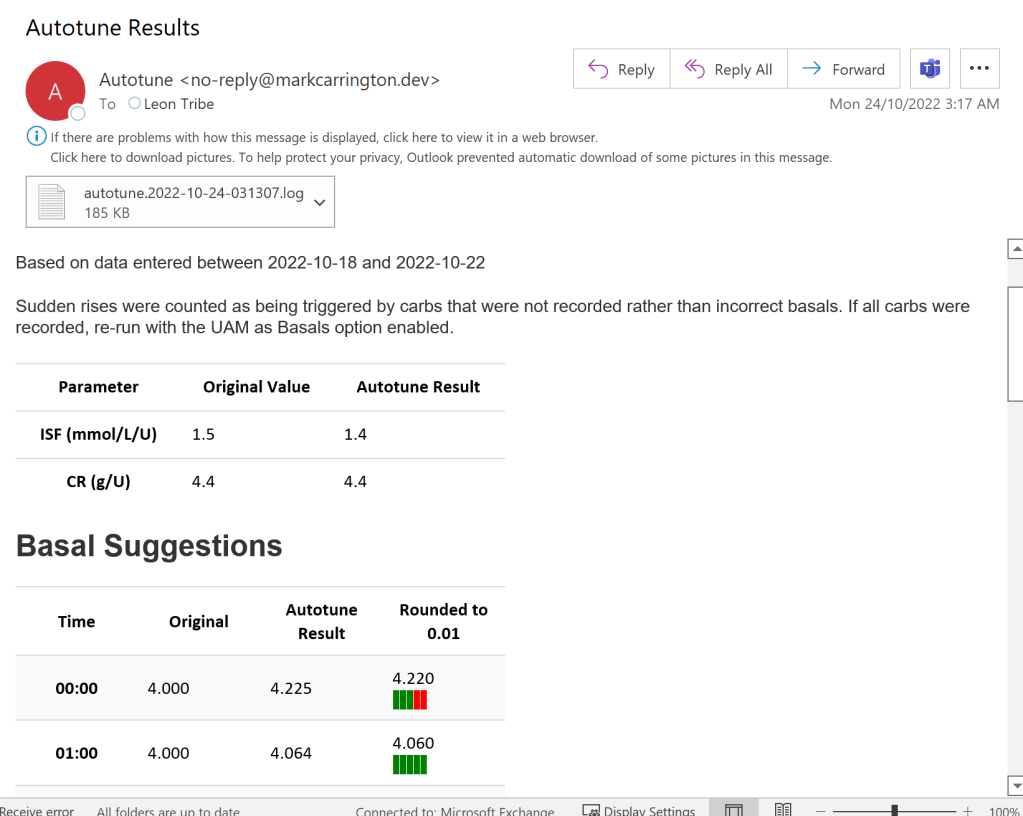
The problem with all of this is how it comes up with these recommendations is not clear so I prefer to compare it to my own conclusions before implementing.
Comparing the Recommendations to Observation
AndroidAPS allows you to display a lot of useful graphs which become meaningful once you start using the system,
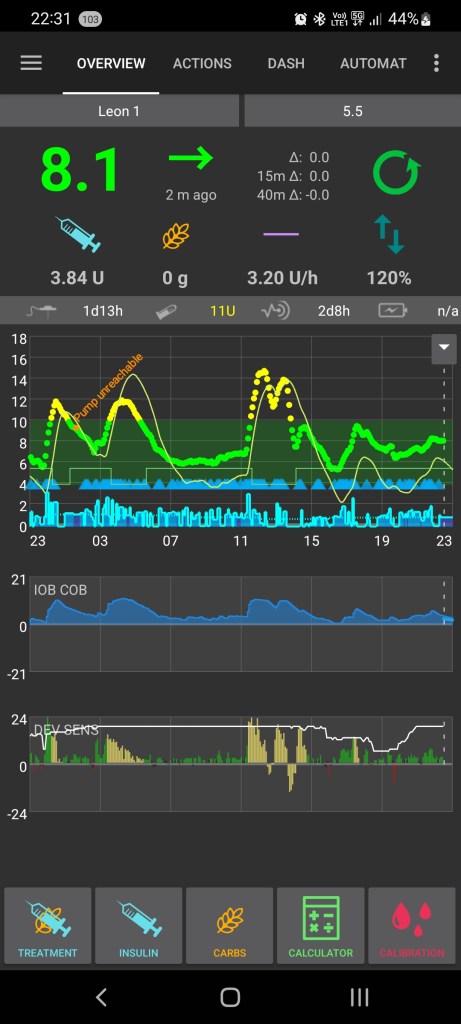
The first graph here is the blood glucose level (yes, it had been quite an interesting 24 hours due to business travel, airport lounges, and all you can eat party pies). The second called “IOB COB” shows the Insulin on Board (IOB). In the case of AndroidAPS this considers basal and bolus insulin and can go negative. Negative IOB means the loop reduced insulin delivery due to a pending low for a sufficiently long time as to affect the usual blood insulin level for basal insulin. A sustained negative IOB can imply that the basal rates are set too high. In the above case the IOB is positive in all six time periods which suggests perhaps the rate is too low.
The second graph shows insulin sensitivity with the white line or, more accurately insulin resistance as a high value means more resistant. The green/yellow/red bars indicate deviations from the expected response of insulin to a carbohydrate intake. In the case of positive values in the deviation it means the insulin was not as effective as expected i.e. the ratio is incorrect.
Running the Comparison of the Graphs to AutoTune
I manage the comparison in Excel. I take values over three days and use Excel formula to compare.
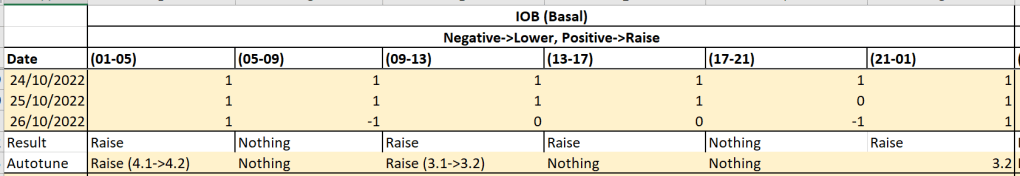
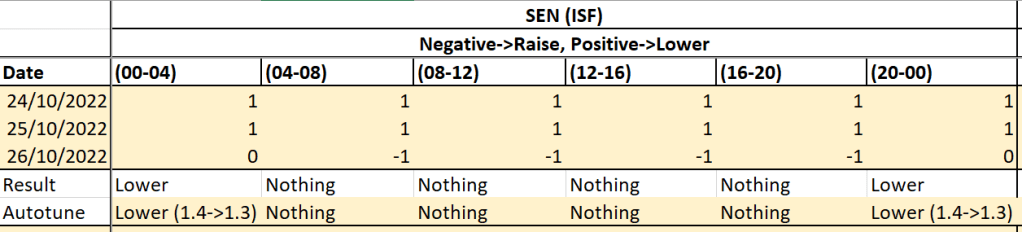
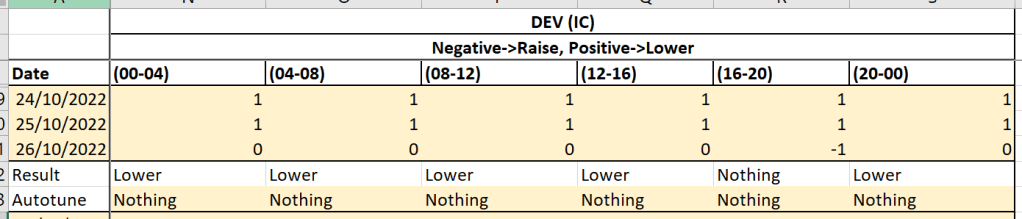
If both my conclusion and Autotune agree with each other, I accept Autotune’s recommendation. Otherwise I leave the value alone.
In the above tables we see that, for this particular period, there was an adjustment made to a couple of time periods for my basal rate, a couple for my insulin sensitivity factor, and no change for my insulin-carbohydrate ratio.
Conclusions
The ability to tune my pump settings with Autotune’s analysis is really powerful and has given me something which is practically a closed loop system. However, as I do not know how it comes up with the recommendations, I prefer not to completely hand over control to the machine. To this end I do my own analysis and move slowly. The three day review removes outliers from any one day (such as crazy numbers from a business trip) and allows for trends to reveal themselves. Working in partnership with the machine has proven to be very powerful and I hope I can achieve similar outcomes with the commercial CamAPS.
