A Cooling Pouch For Less Than US$5 To Help Keep Your Insulin From Overheating

If you have seen the Glucology or Frio insulin pouches you will already understand the concept of an evaporative cooling insulin pouch. They work really well but the downside is the price. For a two-pen pouch you are looking at around US$30. In this blog I will show you how to make your own for less than US$5 (if you have a sewing machine) or, if that is too much hassle, you can buy a ready-made one from my Etsy shop for around US$20 including shipping anywhere in the world or AU$25 including shipping within Australia. For every one purchased, I will be supplying an identical one to charities around the world who are supplying insulin in developing countries where refrigeration is unreliable.

How Do They Work?

Evaporative cooling pouches work off of the idea that if water is evaporating from something, that something gets cooler. This is how humans cool themselves i.e. sweating. The key technology in the cooling pouches that allow them to remain cool for well over 24 hours are the little beads inside the pouch. These hydrophilic beads (a big word meaning they hold onto water) are the same ones you might know as Orbeez or those squishy spheres you see flowers in sometimes.

Magic Moisturizing Crystal Mud Soil Water Beads For Flower Planting Super  absorbent polymer Crystal Soil Jelly Balls Home Decor|soil water beads|water  beadscrystal mud - AliExpress

Same technology, different application. While the beads love holding onto water, it still evaporates and, while it does, they and anything they are surrounding feels cool to the touch. Embed them in material and that material, and anything it is surrounding also becomes cool.

DIY Step One: The Materials

Firstly, you will need two cooling scarves. They look like this:

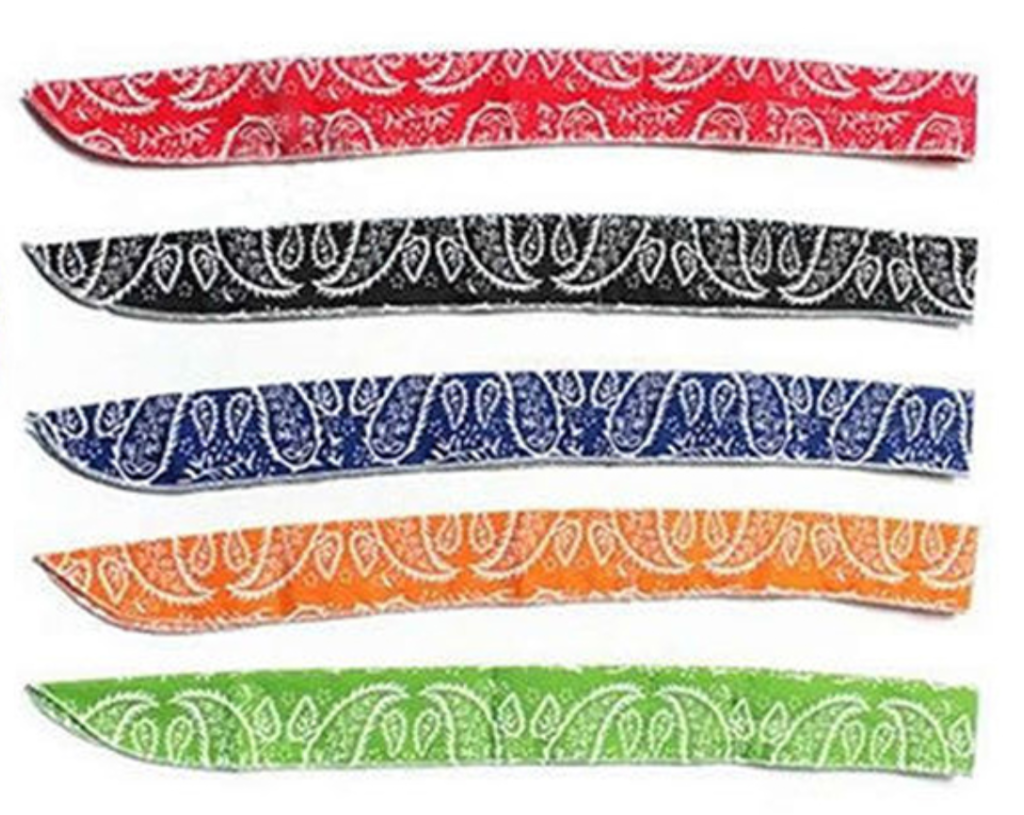
You can buy these from Amazon but this will set you back about US$4 each before postage. Go to Ebay and select the international option and, while it might take a little longer to arrive, you can pick them up for around US$1 each.

You will also need a sewing machine or someone with the time to hand stitch them.

DIY Step Two: Stitching

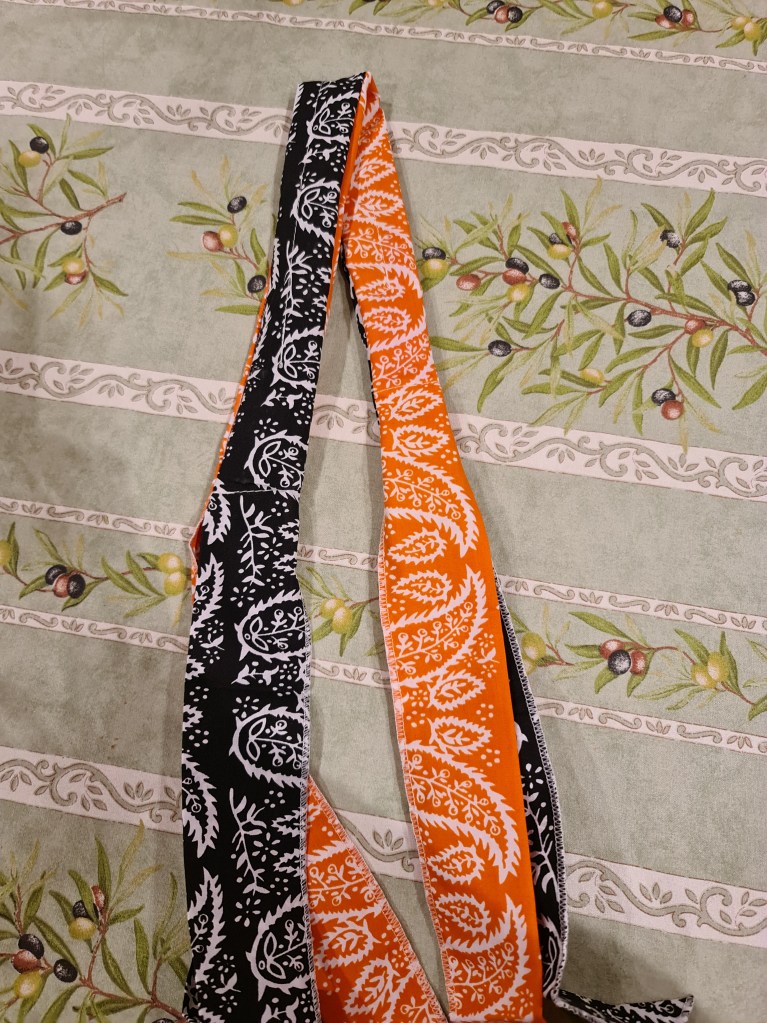
Lay one on top of the other. For symmetry, I have put the seam of one (the white stitching on the edge) to the non-seam side of the other.

Then you will want to do a straight stitch along the edges so the two pieces form a long tube.

The dark line at the bottom on the scarf in the above picture is the straight stitch you need to do on the top and bottom. There is one at the top in the image as well but, because I was using a light brown thread in my bobbin, it is a little tricky to see. While I went a little over in the above picture, you want to go up to the white stitching which runs up and down on the left hand side in the above picture. This gives you the ties on the end of the scarf to secure the pouch, once finished.

DIY Step Three: Inverting

Arguably the fiddly bit, you now push the tube inside of itself to invert it and hide the stitching. I found the best way was to pull it out, rather than trying to push it through with a stick. In the end you will have an inverted tube which looks something like this.

You are now the proud owner of a cooling insulin pouch. Well done!

How To Use Your Pouch

Before use you will need to soak your pouch. I recommend no more than five minutes. Any more than this and the beads will absorb too much water and make it too hard to insert the pens/cartridges/vials. There is probably a risk of splitting the stitches as well.

Once soaked, dry it off with a dishcloth or towel. The material does not have to be wet for it to be effective. It is the beads inside which do the work.

Then, you can insert your hardware.

In the above example, I have my basal and bolus insulin pens and a MedAngel (a Bluetooth thermometer which connects to your phone).

Once inside, you can use the those end ties to keep it all together.

Does It Really Work?

While I am still insulin independent, I always carry insulin whenever I travel overseas for work. Just before the world locked down, I took my pouch to Singapore. Even with Singapore’s humidity, the pouch, within my backpack, was effective at keeping my insulin cool as I walked, in the direct sun, to the office each morning. Tests I have conducted in more controlled conditions show the pouch is as effective as its commercial counterparts.

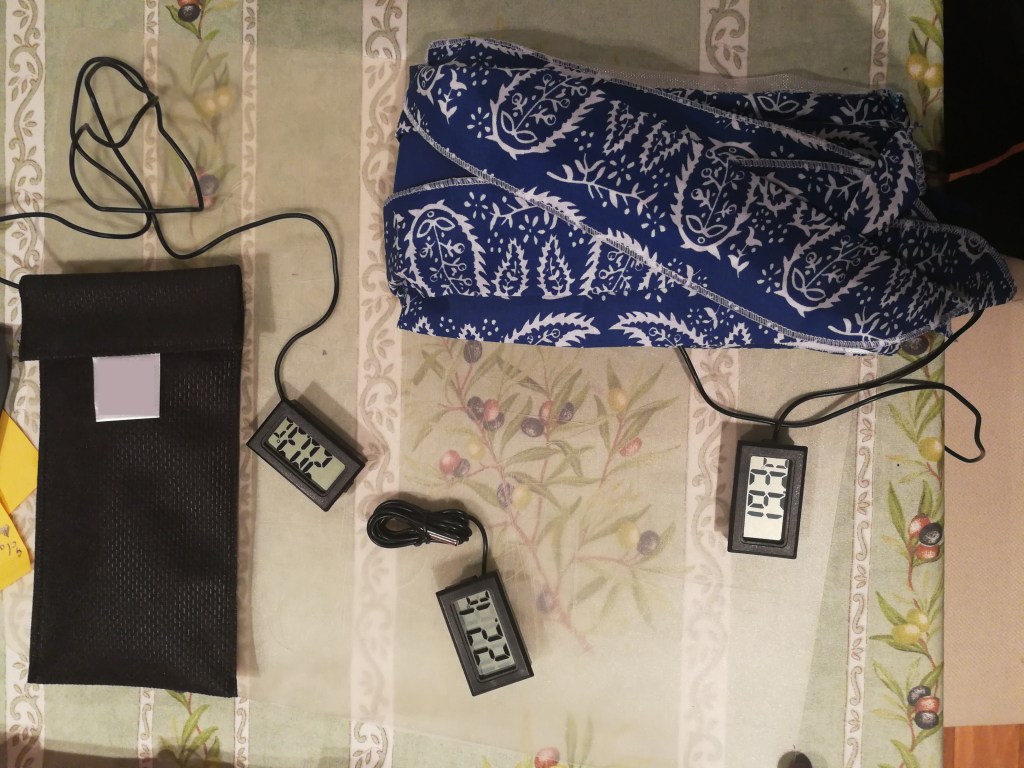
Here you see three temperature gauges measuring (in Celsius) the temperature in my house (the middle one), the temperature of a commercial pouch (on the left) and my one (on the right). Even inside, both pouches shaved off 2-3 degrees Celsius (4-6 degrees Fahrenheit). The effect becomes even stronger in direct sunlight where I have seen temperature differences of 10 degrees Celsius (20 degrees Fahrenheit) between the ambient temperature and the pouch.

“Recharging”, Storage and Care

The pouch will continue to keep the contents cool for over 24 hours. When you want to “recharge” it, immerse it in water for no more than two minutes. Again, if you over-immerse, you risk expanding the beads too much and making it impossible to insert your pens etc. or breaking the stitching.

If you are not planning on using your pouch for a while, let it completely dry out in the sun or on an air vent and, when completely dry, store it in a cool, dry place.

EASD 2020: Life Expectancy of People with Type 1 Diabetes (A Review of Hope)

Let me cut to the chase on this: if you have been recently diagnosed with diabetes and you maintain good glucose control, based on this evidence, there is NO reason to expect you will not live a long and healthy life

This may sound wrong because it is easy, from a statistical point of view, to work out the difference in life expectancy between people with diabetics and non-diabetics and show people with diabetes live for a few years less than non-diabetics. Sure enough, Mike Stedman and his colleagues did precisely this for EASD 2020.

What this tells us is that Type 1 males live 7 years less than their non-diabetic counterparts and, for women, it is 8.5 years. For Type 2, the difference is less pronounced being 1.4 years lost for men and 2 years lost for women.

The problem is the data, while accurate, is very misleading. Moreover, it hits social media and diabetes groups, and Type 1s think it is inevitable that they will live shorter lives than their friends and families. The stresses of diabetes are plentiful without this kind of burden being added on top.

The fact of the matter is this graph says absolutely nothing about the life expectancy of an individual. Rolled into that average life expectancy are hypo deaths, DKA deaths, and things like heart complications. We know higher HbA1c levels increase the risk of cardiovascular (heart) disease so, for someone with good glucose control, in my opinion, the above graph is meaningless. It also says nothing about age of onset. Someone who was diagnosed 50 years ago (included in the above numbers) had to manage their diabetes with urine, thick needles, and a lot of luck. Someone diagnosed today has much more effective tools at their disposal.

In my opinion, it would be much smarter to look how life expectancy has improved over the years and, where possible, see if it is catching up with the non-diabetic population. This is what I want to write about today. As usual, you can skip to the tl;dr for the summary, otherwise let us go on a journey of optimism, rather than of pessimism. Firstly though, what is up with that gender imbalance in life expectancy?

Why Do Females with Diabetes Have a Shorter Average Life Expectancy?

Again, let me repeat the disclaimer: Average life expectancy says nothing about the life of an individual. A woman with good glucose control has, in my opinion, no reason to expect any shorter life than her non-diabetic peers.

To the question at hand though, another presentation at EASD 2020 looked at this in some detail. Juergen Harreiter presented “What you need to consider for individualised gender-sensitive care”. This looked at the gender differences in diabetes risk and treatments.

Sure enough females with diabetes are at a higher risk of coronary heart disease and stroke than their male counterparts.

and a 40% greater risk of all-cause mortality.

Specific reasons, backed up by data, were light on the ground except for this cited study.

In the above graphs, we have four drugs commonly used to reduce the risk of heart disease. For three of them (statins, RAAS blockades, and beta-blockers) women were routinely under-treated. With males receiving more aggressive treatment, it is not surprising they live longer.

So What About Life Expectancy Improvements over Time?

There is overwhelming evidence that life expectancy is improving every year for people with diabetes. While the cause of the improvement is not always clear, I suspect it has to do with improvements in management technology (insulin improvements, pumping, glucometers, looping etc.) and possibly improved knowledge and education about the disease. Let us go through the papers I have found.

Life expectancy and survival analysis of patients with diabetes compared to the non diabetic population in Bulgaria (2020)

This study looked at data from 2012-2015 using national databases. Even in this short period of time we see improvements across both Type 1 and 2 and across genders.

While the non-diabetic population did not move at all in their life expectancy, Type 1s, Type 2s, Type 1 females, and Type 2 females all gained around an additional year, on average. Moreover, by 2015, the overall life expectancy of people with diabetes was about the same as the non-diabetic population (almost 75 years).

Improvements in the Life Expectancy of Type 1 Diabetes (2012)

In this study the life expectancy of two cohorts was examined: people with diabetes diagnosed between 1950-1964 and between 1965-1980.

Here we see the percentage of survivors after a certain age. The EDC (Pittsburgh Epidemiology of Diabetes Complications) cohort for 1950-1964 are lower on the graph as fewer survived over the years. In comparison, the 1965-1980 cohorts for EDC and ACR (Allegheny County Type 1 Diabetes Registry) had a much higher survival rate again showing the difference just 15 years made in the life expectancy of people with diabetes.

Long-Term Mortality in Nationwide Cohorts of Childhood-Onset Type 1 Diabetes in Japan and Finland (2003)

This study was designed to compare Type 1 diabetics in Japan and Finland but also had information of improved survival rates over the years.

While in Finland, the survival prospects of a Type 1 child remained excellent for the periods 1965-1969 and 1975-1979 with only minor improvements, we see there was a dramatic improvement in survival probability for children diagnosed in the latter period for Japan.

The 30-Year Natural History of Type 1 Diabetes Complications (2006)

This study looked at five 5-year cohorts (1950-1959, 1960-1964, 1965-1969, 1970-1974, and 1975-1980) also from the Pittsburgh Epidemiology of Childhood-Onset Diabetes Complications Study. Not surprisingly, it came to similar conclusions.

We see a clear improvement in survival rates with around 60% of those diagnosed in the 50s and living with the disease for 30 years surviving, compared to around 95% for those diagnosed in the 70s.

All-Cause Mortality Trends in a Large Population-Based Cohort With Long-Standing Childhood-Onset Type 1 Diabetes (2010)

This study split the previously mentioned ACR study into three diagnosis cohorts (1965-1969, 1970-1974, and 1975-1979) to compare survival rates.

As we have seen in the other studies, there was a dramatic improvement in survival rates between someone diagnosed in the late 60s compared to the 70s.

A Word of Warning

In the above studies we have looked at people with diabetes in Bulgaria, USA, Japan, and Finland and, as mentioned, it is likely the improvements are due to improvements in medical technology and education. For countries where these improvements are not available, there is no reason to expect the same gains. For places in the world where insulin is not readily available, there is no reason why life expectancy should be much better for a person with diabetes than it was before the discovery of insulin 100 years ago. These studies show there are compelling reasons for insulin to be available to all who need it, across the world. We are literally robbing people of decades of life if we choose to do nothing.

tl;dr

There is clear evidence that the survival rates for people with diabetes has improved for those diagnosed between 1950 and 2015. Furthermore, in a study from Bulgaria by 2015, the life expectancy of people with diabetes was the same as non-diabetics.

While the specific cause of the improvements was not examined, it is assumed to be a function of improved technology (insulin, pumps, glucometers, looping etc.) and improved understanding and education of the disease.

Therefore, if you have been recently diagnosed with diabetes and you maintain good glucose control, based on this evidence, there is NO reason to expect you will not live a long and healthy life.

Bringing Consulting Skills To The Medical Industry

Outside of writing these blogs, I have a day job which involves the implementation of software to help organizations manage their customers and processes more effectively. I have been doing this job for around 20 years and worked at a couple of the “Big 4” Consulting companies along the way. It is fair to say I understand a thing or two about professional consulting.

Yet, when I go to conferences and hear medical professionals speak, or when I visit diabetes forums and hear of diabetics’ experiences with medical professionals, it is clear there is a problem. For my own medical team I could not be happier. Our conversations do not focus on ‘adherence’ and ‘non-compliance’ but on working together to find the right solution. For other diabetics this is not the case causing mental stress for individuals who, for the most part, are doing everything within their power to stay healthy.

A great example highlighting the problem was this image recently posted by Renza Scibilia.

Image

While not every software implementation project is a success, I would never dream of giving a ‘report card’ to my clients. They are paying me and the company I work for to give them the best possible advice and give them the best possible chance of success. To give my client a rating would be the height of arrogance and conceit and shows a profound misunderstanding of the relationship between us. If my client fails, I have failed and a rating is as much an indictment, if not more so, of my consulting than it is of the client who paid me to deliver success.

The fact is, the relationship between a patient and a doctor, especially a medical specialist, is no different to the relationship between a client and a professional services consultant. The stakes may be higher in the medical field but the dynamic between the consultant and the client should be the same. So what can we apply from professional consulting to modern medicine? As usual, if you want to get to the destination without going on the journey, you can always skip to tl;dr.

People, Process, and Technology

It is well known in IT consulting that the success of a project goes beyond the technology. A common framework for considering the various factors of a project is to consider the People, Process, and Technology.

Leon's CRM Musings: The Interplay of People, Process and Technology

In this model we have:

  • Process: Something we are trying to manage, essential to the ‘health’ of the business
  • People: Those affected by the process
  • Technology: The tools used to manage the process

Only when these are considered together is the project likely to be a success.

The parallel model for a patient is not a huge stretch:

  • Process: The disease i.e. diabetes
  • People: The patient
  • Technology: The medications and technology used to manage it

Implementing technology with no consideration of the other two factors is almost always a disaster. In the same way, throwing drugs at a patient with no consideration of who they are or how the disease affects them in their day-to-day life is an incomplete solution.

Just as every workplace has similar processes but each has their unique aspects so too with patients and their diabetes. Is it practical for the patient to inject multiple times per day given their job/circumstances? Can they afford the drug/pump/CGM/test strips you are recommending/prescribing? Does the patient have the necessary training/knowledge to manage their medication/technologies effectively? If the answer to one of these is “no”, is it really the patient’s fault when they fail to meet the doctor’s expectations? Is it a case of adherence/non-compliance or a consultant failing to do their job?

As Sir William Osler famously said:

The Trusted Advisor

The ideal situation for a consultant is to be considered a trusted advisor. If the client sees you this way it means they trust you to do the right thing by them and they are more likely to follow your suggestions and, as importantly, confide in you when they feel your ideas may not work.

In my opinion, there is little room for ego when it comes to being a trusted advisor. While you are the expert, humility goes a very long way. It should be very clearly understood who is paying for a service and who is providing that service. The consultant is there at the pleasure and to serve the client, not the other way around.

Being a trusted advisor maximizes the chance of a long term relationship. I have clients who I have been working with for over 15 years, despite working for multiple companies in that time. My clients come to me because they know I will give them the best possible advice I can to help them and not make them feel stupid in asking.

The Client Knows More Than The Consultant

This sounds counter-intuitive given the consultant is being paid for their expertise. However, from a disease perspective, someone who has had diabetes for 20 years will likely know more than a general practice/primary case doctor and are probably more up to date on the latest literature. Why is this the case? Because a doctor gets, at most, an hour or two on diabetes in their entire multi-year training to become a doctor. Whereas someone with diabetes has a strong motivation to understand the latest information on their disease. This will not be as applicable to diabetologists/endocrinologists but it is still completely true for the other aspects of the patients’ life.

In fact, this is probably the hardest lesson for a professional consultant to learn: sometimes the client will ignore your advice and they are completely right in doing so, no matter how insistent you are that it is a mistake.

In professional services, the client knows their business better than the consultant ever will. Therefore, if a consultant provides two options: a good one and an ok one, sometimes the client will still go with the ok solution because they know it has more chance of success despite the consultant’s insistence that the other solution is better. Even if the consultant is not considering the People and Process, the client will be.

What Can Patients Do?

The most productive relationships and best outcomes I have had with my clients is when they invest the time to learn all they can about the technology being implemented. Getting educated gives them the power to ask the right questions and get better solutions; they understand the strengths and weaknesses of different approaches and can challenge the consultant’s assumptions.

If, as a diabetic, you are keen to learn more about your disease and how it is treated, here is a blog article where I provide references to a raft of educational resources. It was using resources like this that allowed me to propose medications to my endocrinologist, based on the latest research, which seemed to lead to a better outcome. She considered my proposal, did her own research and, together we found a solution. This is how we continue to work today.

tl;dr

As a professional consultant with over 20 years experience, I understand the intricacies of working with clients to give them advice and steer them towards success. There are many great medical professionals out there but, based on what I see in diabetic forums and the language used in conferences, it is clear that some professionals could employ a consulting approach towards their patients.

While I could probably write enough to fill a book on professional consulting techniques and their application to medical professionals, I have limited this article to three key concepts:

  • Treating a disease goes beyond medication. The phenotype of the disease for that individual, as well as their personal circumstances are crucial elements to consider
  • Humility goes a long way in building a trust and rapport. Understanding that the doctor is simply someone being hired for their knowledge and skills is a good start to fostering such a relationship
  • Despite the consultant believing they know all the answers, sometimes the patient will ignore the consultant’s advice and it is completely the right thing to do. The patient will always know more about their disease and their personal circumstances than the doctor will

Finally, as a patient, it is in your best interest to understand, as well as possible, your disease and the medication options. This will not only mean you can ask the right questions but also improves the prospect of working with your health case team for the best possible solutions.

EASD 2020: A Weekly Basal Insulin Being Developed

I am coming to the end of my EASD 2020 series but what a conference it was for announcements and discoveries. It just goes to show that research into diabetes is thriving and it suggests we have a lot to look forward to in the future with continual advancements in medical treatments and technology,

The presentations on Insulin Icodec, a once-weekly basal insulin, was particularly exciting for me.

What is Insulin Icodec?

Insulin has come a long way in the last 100 years. Early forms of insulin were derived from farm animals but, with the advance of recombinant DNA (the ability to combine DNA from multiple sources), it became possible to manufacture insulin with bacteria or yeast. Mass production of ‘regular’ insulin (human-equivalent) followed until the mid-nineties. In 1996 a new form of insulin was introduced to the market by Eli Lilly in the form of ‘Lispro rDNA’. This was a genetically modified form of insulin which acted in the body like regular insulin but with modified properties.

Since then, insulin analog advances have been made to improve how quickly a rapid-acting insulin takes to reach peak activity or, in the case of basal insulins, to make them last for longer and more consistently in the body.

Insulin Icodec is very much in this second camp. While some basal insulins, up until now, could work for around 24 hours, this is not the case for Icodec which makes basal insulin available to the body over a period of one week.

Presentations

Ulrike Hoevelmann presented on the effectiveness of the insulin. As we can see here, it maintains a relatively constant supply of insulin to the body over the seven days.

This particular research involved 50 participants and explored the properties of Icodec compared to Degludec (Tresiba).

Julio Rosenstock presented on a study with 247 participants comparing daily basal injections with weekly injections in a double-blind, double-dummy test. Once-weekly insulin Icodec showed a higher rate of hypoglycaemic events, compared to daily basal insulin glargine U100.

However, Doctor Rosenstock was quick to point out the only difference which was statistically significant was the Level 1 hypos. In all other aspects compared, there was no statistically significant difference in outcomes or adverse events between the two insulins.

Only For Type 2s?

Both studies focussed exclusively on Type 2s. So, will Icodec also work for other Types, such as Type 1? I asked this in one of the presentations and was told it certainly will but this is not where they are researching right now. My guess is the research trials are focussing on the majority of diabetics i.e. Type 2s. It is still early days so I am sure, before Icodec reaches the market, it will also be tested in Type 1s. While some Type 1s I know have expressed concerns around the risks of being subject to a bad dosing decision for an entire week, I think this would affect all patients about the same, regardless of Type. Personally, I think the more technology can remove the burden of management from diabetics and carers, the better and going from 365 injections a year down to 52, for me, is compelling.

Time In Range – The New HbA1c

Most diabetics, certainly most Type 1s, know their HbA1c. As described previously, the HbA1c is a measure of the ‘average sugariness’ of the blood over the last three months. As a diagnostic test, the HbA1c has been with us for a little over 40 years and has served us well. However, as technology has improved for the management of diabetes, the ways we keep tabs on our blood has also evolved and a new measure: Time in Range is growing in popularity among both diabetics and researchers alike. In fact, quite a few talks at EASD 2020 spoke directly at Time in Range and linked it to the long term health of diabetics.

In this blog I will talk about what the HbA1c tells us, its limitations, and the additional insights we can gain through the Time in Range. As usual, at the end, we have the ‘Cliff Notes’ tl;dr.

Benefits of Measuring the HbA1c

As I have shown previously, many papers examine the relationship between long term HbA1c and complications and this was reiterated by Professor Pratik Choudhary at EASD 2020 with this excellent graph.

The Limitations of the HbA1c

While of diagnostic value, there are limitations with the HbA1c measure.

Firstly, the measure assumes the lifespan of the red blood cells as part of the calculation so, if this assumption is invalid, it can affect the HbA1c. Common causes of false HbA1c readings include:

  • Anaemia
  • Excessive alcohol consumption
  • Excessive use of opiates
  • Pregnancy
  • Blood transfusions

The second and arguably biggest limitation of the HbA1c measure is while it speaks to the ‘average sugariness’ it says nothing of the variation. This is why, historically, doctors have erred on the side of a higher HbA1c with Type 1s, often to the diabetic’s frustration. The reason is simple: if the diabetic’s glucose levels fluctuate significantly, and they keep a lower glucose level, they are at an increased risk of hypo whose effects are immediate (groggy, fall over, go unconscious etc.) whereas running a little ‘high’ and fluctuating mitigates the risk of hypos at the expense of increasing the risk of long term nerve damage. To put it simply, with limited visibility of the fluctuations using strip glucose monitors, it makes sense that doctors err to minimize risk today and encourage their patients to run a little higher with a view that the longer term risks can be managed later.

Interestingly, in his talk, Professor Choudhary blamed his patients for running high and having high fluctuations, suggesting they are driven by fear of a hypo which then leads to over-correcting and large fluctuations.

Fortunately, Continuous Glucose Monitoring (CGM) technology gives a much clearer picture of the fluctuations, informing both the doctor and patient, and allowing them to proceed informed, rather than out of fear.

Time in Range

It has taken a while for a standardization of Time in Range guidelines but in August 2019 we got one from the ADA.

The standard is adjusted for various sub-groups of diabetics.

What is more, these ranges are not random, or at the whim of some group of doctors, but backed up by statistically significant links to both long term complications and the equivalent HbA1c.

Some of these were highlighted by Professor Richard M. Bergenstal.

and Anass El Malahi at EASD 2020.

As we can see, we can link changes in Time in Range to changes in the risk of retinopathy, microalbuminuria, microvascular complication, and nephropathy.

Professor Bergental also showed, using the CGM data of three of his patients, how much more insightful Time in Range can be, compared to HbA1c.

Here the three patients have exactly the same HbA1c but very different experiences with their diabetes. with the third patient spending a lot more time in hypo and much less time in range.

Bringing together the Time in Range with the latest data on what it means for long term complications, the Ambulatory Glucose Profile (AGP) Report captures the key metrics along with statistically significant guidelines in one page.

As we can see the report captures:

  • Percentage time in the different BGL ranges
  • Average Glucose
  • Glucose Management Indicator (GMI): an estimation of the HbA1c
  • Glucose variability: a measure of fluctuation

which, given the GMI on its own is a proxy for the HbA1c, shows we are considering a lot more information in the AGP report than simply ‘average sugariness’.

The Big Problem with Time in Range

The big problem with Time in Range analysis is it requires a Continuous Glucose Monitor (CGM) to capture the data: it is a metric of privilege. While many of us have no exposure to it in the West, in places like Mexico, some Type 1 diabetics are given literally one strip per day to manage their blood glucose levels. Fortunately, research shows the proportion of finger pricks in, below or above range can still be correlated to HbA1c estimations and, therefore, give an indication of long term risk.

Also, with an increase in Time in Range of 10% leading to a lowering of HbA1c of 0.5%, using the above, we see that for someone whose finger pricks are in range 70% of the time, this correlates to an HbA1c of roughly 7%, as with the CGM data. This means the AGP Report and the guidelines it contains can be applied to CGM or finger pricking equally. So, while a diabetic’s management technology may change over time, their reporting for their health care team does not have to.

tl;dr

With the advent of Continuous Glucose Monitoring (CGM) we have new and insightful ways of examining our data beyond what is available with finger pricking and the HbA1c. One such way is analysing the Time in Range of our data. Time in Range provides a wealth of knowledge about both average sugariness and the glucose level fluctuations. One way to present this information is with an Ambulatory Glucose Profile (AGP) Report.

While driven by CGM technology, it is possible to use the AGP Report with finger pricking by considering the proportion of results that fit in the low medium or high categories. This now means we have a common report whether we are finger pricking or using CGMs.

Clinical research using Time in Range analysis has also established that it is predictive for a range of long term diabetes complications. This means, Time in Range analysis and the AGP Report are now a viable alternative to the HbA1c and provide much richer insights.

The Benefits of Incretin Mimetics For All Diabetics

I first read about incretin mimetics in Dr. Bernstein’s fourth edition of “Dr. Bernstein’s Diabetes Solution” published in 2011. He devotes nine pages to this class of drugs and it is a good place as any to describe what they do. It should be noted for those unfamiliar with Dr. Bernstein, his focus is on the treatment of Type 1 diabetes. While incretin mimetics are sometimes hailed as a ‘Type 2 drug’, they can be of benefit to diabetics of all Types as I will show in this blog.

From there I will update the information based on some peer reviewed papers from recent years (specifically relating to LADA) and the presentations at the recent EASD 2020 conference and then onto my own experience using them. As usual, there is the tl;dr at the end if you want the short version.

What Are Incretin Mimetics?

To understand the role of incretin mimetics, it is important to understand that beta cells produce, not just insulin, but also another hormone called amylin. Amylin is a ‘satiety’ hormone i.e. it makes you feel full. So, as the beta cells become damaged they are less able to produce this hormone. Amylin is released in response to the presence of ‘gut hormones’ in the blood, released when the gut is stretched. These ‘gut hormones’ are called ‘incretins’.

Based on all this, Dr. Bernstein suggests that diabetics of all persuasions are likely to not feel as ‘full’ as their non-diabetic counterparts. For me, this poses the question: “If someone who has impaired beta cell function cannot effectively regulate their eating, is it possible Type 2 diabetes and pre-diabetes causes obesity and not the other way around?” but that is a blog for another day.

At the time of writing his book, Dr. Bernstein describes incretin mimetics as being used to lower blood sugar levels after meals and for weight loss. We now know they have many more effects on the human body.

GLP-1 Receptor Agonists (GLP-1RAs) are one such incretin mimetic. As per the above we see, among other things, they can:

  • Lead to weight loss (likely due to the increased sensitivity to feeling full)
  • Lower glucagon secretion (meaning the liver releases less glucose into the blood)
  • Stimulate insulin secretion and production (to process the food that is causing the stomach to feel full)
  • Decrease beta cell apoptosis (this is the fancy name for programmed cell death. Cells in the body are given a countdown clock. When that clock reaches zero the cell destroys itself. Incretin mimetics tinker with that clock to extend the life of beta cells)
  • Offer protection from heart disease
  • Lower blood pressure

I should note that while these drugs do stimulate insulin production like, say, sulfonylureas unlike ‘sulfs’ the evidence shows this does not accelerate the demise of the diabetic’s honeymoon. My guess is the suppression of apoptosis counters the effect. Another possible explanation is, because the insulin is getting triggered earlier and harder, the blood sugars are not getting the opportunity to rise as high. Dr. Bernstein talks about how it takes more insulin to bring blood sugar down by a fixed amount when it is at a high level than when it is lower. So, the mimetics get the insulin out early when it is more effective and therefore the net production for a given meal is less.

Types of Incretin Mimetics

There are three types of incretin mimetics. These are:

  • Amylin analogs: To my knowledge the only one on the market is Symlin (pramlintide). This is available by injection. I have not tried this one. EASD 2020 had a presentation on using it in a dual-hormone therapy (pumps with insulin and pramlintide) but the benefit of the additional pramlintide, in this context, was minimal.
  • GLP-1 agonists (mentioned above): This is mentioned above with the associated effects. Until recently this was also only available via injection. Recently an oral version has been released (more of that later). I am currently on a once-weekly injection of this drug. Here are the six GLP-1s on the market at the time of writing.
  • DPP-4 inhibitors: DPP-4s destroy GLP-1s in the body so this drug opposes that destruction and therefore, in principle, eliminates the need to inject GLP-1s. DPP-4s are available in an oral form and I took these for at least six months before moving to the GLP-1 agonists.

Contraindications and Side Effects

I will list some of the more common side effects but this list, like for most drugs, is far from exhaustive so discuss your specific history with your health care team to get a full picture of how well these drugs might suit your circumstances and complication risk profile.

Firstly, incretin mimetics slow stomach emptying so this can make gastroparesis (a condition not uncommon in Type 1s) worse. This slowing can also induce nausea. People on social media will be more than willing to tell you how incretin mimetics made them violently ill. For me, I feel mild nausea a day after injecting the GLP-1 agonist (akin to very mild car sickness) but felt no such effect when taking the DPP-4 inhibitors.

One side effect that was actually beneficial for me was constipation. As I also take Metformin, I have found the GLP-1 agonist and Metformin balance themselves out nicely giving me a lot of freedom I did not have when taking Metformin with the DPP-4 inhibitor. It is different for everyone though as GLP-1 agonists are also reported to have diarrhoea as a side effect.

One of the more serious side effects is the risk of reversible pancreatitis. I am informed pancreatitis is one of the most painful things you can experience and is usually characterized as a sudden, severe abdominal pain extending through the body from the back to the front. As the name suggests, stopping the medication reverses the condition.

LADA-Related Studies on DPP-4 Inhibitors

Given I am a Type 1 LADA trying to preserve my beta cells as long as possible and avoid the financial and mental stresses of insulin management, many of the studies I have earmarked, up to EASD 2020, are focussed on blood glucose management and beta cells preservation. Here are a few:

Presentations From EASD 2020

Tina Vilsbøll presented on Semaglutide, a new GLP-1 which can be taken as a once-weekly injection or as a once-daily oral pill, both being equally effective.

Juris Meier went into more detail as to the efficacy of the oral version, compared to other GLP-1 agonists, in Type 2s, showing it was more effective at reducing HbA1c.

The oral version of Semaglutide also compared favourably to the DPP-4 inhibitor Sitagliptin at doses above 3mg for Hba1c reduction and weight loss.

The downside was an increase in adverse reactions at the higher doses, compared to Sitagliptin.

So, if you are considering swapping out Sitagliptin for Semaglutide, understand that for a superior effect on HbA1c and weight loss you are also at a greater risk of those adverse effects.

Alice Cheng showed how the injectable version compared favorably to both DPP-4 inhibitors and other GLP-1 agonists for reducing HbA1c and weight loss.

For adverse effects, Semaglutide was comparable to other GLP-1 agonists.

My Experiences With DPP-4 Inhibitors and GLP-1 Agonists

As mentioned, I have used both in an attempt to preserve my beta cell mass. For me, the DPP-4 Inhibitor had no side effects or, at least, any side effects were washed out by the ones from Metformin. The DPP-4 Inhibitor did nothing for me in terms of HbA1c reduction (although it is already in the mid-5% for this is not surprising), satiety, or weight reduction.

My experience with the injected GLP-1 agonists has been very different. Given the trouble I was having with Metformin, I halved that dosage but found the two drugs balanced each other nicely, as touched on before. I have lost five kilograms over a couple of months (I have it to lose) which I attribute to my significantly reduced appetite and improved sense of satiety. It is only now I realise it has been years since I actually felt full eating food and the GLP-1 agonist has given this back to me.

tl;dr

While traditionally considered a ‘Type 2 drug’, there can be benefits in incretin mimetics for all Types of diabetics. For all Types we have the general benefits of:

  • Lowering blood pressure
  • Lowering the risk of cardiovascular disease
  • A sense of feeling ‘full’ which may be lacking in diabetics
  • A lowering of HbA1c
  • Weight loss (especially for the GLP-1 agonists)

For Type 2s, the benefits also include the lowering of blood sugar levels through the increased release of insulin after meals and supressed release of glucose from the liver.

For Type 1 LADAs there is growing evidence that incretin mimetics can help preserve beta cell function and prolong the honeymoon. Certainly the latest guidelines for managing LADA fully embrace incretin mimetics even if, formally, they are not approved for use in Type 1s.

In terms of side effects, incretin mimetics can cause stomach issues and nausea but, generally, these are mild and much less pronounced in DPP-4 inhibitors.

New innovations in incretin mimetics include:

  • An improved once-weekly GLP-1 injection and
  • An oral GLP-1 taken once-daily

While superior to similar products on the market in terms of their effects on HbA1c and weight loss, it comes at the cost of increased risk of side effects such as nausea, diarrhoea, and vomiting.

EASD 2020: What Are The Benefits Of A Low Carb Diet For Loopers?

One of the presentations at EASD 2020 looked at whether adopting a low carb diet provided benefit to hybrid loopers. Given I know of low carb loopers that no longer declare meals I expected the answer to be “yes”, just like the cycling presentation, but I believe there is still value in looking at how the study was put together and what it specifically found. As usual we have tl;dr at the bottom if you want to cut to the chase.

Details of the Analysis

The presenter was Dr. Vera Lehmann.

Essentially, she looked at the data across 30 days of, based on the picture below, a Medtronic looping pump. Carbohydrate intake was taken from the participant declarations to the pump. In total there were 36 participants involved in the study.

To work out if lower carbohydrate intake affected Time in Range, rather than compare participants against each other, they took an average carb intake for each participant over 30 days and then measured their intake relative to this for each day.

Why did they not just compare the low carb folk to the high carb folk? I am not sure but perhaps this would introduce confounding factors e.g. perhaps low carb folk are skinnier than high carb folk and it could be the difference in weight causing the better control. By measuring to the individual, these issues are eliminated.

UPDATE: Dr. Lehmann was kind enough to respond to this question saying “We chose a relative approach to account for the intra- and interindividual variability in CHO intake and the confounding factors including weight (a tall, heavy man eats more carbs in grams per day than a small, lightweight woman). We could not categorize our population into low carb folk and high carb folk since there was a high variability in CHO intake between each day (some people had an individual range between 70 to 240 g carbs per day).”

Results

There was not too much of a surprise in the results.

The low carbohydrate days had the highest Time in Range (blue) at around 80% but even the high carbohydrate days were not bad at around 70%.

For Time Above Range (green) the low carbohydrate days were up there for about 15% of the time and this went up to around 25% of the time for the high carbohydrate group.

No statistically significant conclusions could be drawn for Time Below Range.

What is interesting to me is that, even with the high carbohydrate days, the percentages were still within the recommended guidelines for diabetics.

Limitations

Limitations acknowledged by the presented included:

  • All participants were recruited from the same medical centre which means selection bias is possible
  • The study was over a limited time period and longer time studies were recommended
  • Carbohydrate quality and other macronutrients were not considered in the analysis
  • Carbohydrate values were the estimated declarations of the participants with no validation of accuracy
  • The participants were mostly male Caucasians

tl;dr

There is evidence that, even with a hybrid looping system, lower carbohydrate intake results in a better Time in Range (TIR) and a reduced Time Above Range (TAR). However, looking at the results, the TIR and TAR values were still within the recommended guidelines for the days when participants ate higher levels of carbohydrates than usual. In other words, if you are using a hybrid loop and you have the occasional carb-loaded day, it seems the looping system is sufficiently robust to keep it from being a complete disaster from a blood glucose perspective.

The exciting aspect of this for me is, assuming the TIR guidelines are accurate in minimising the risk of long term complications, as looping technology becomes more widespread, we should see a measurable reduction in such complications and a lot less mental stress for diabetics with automation making care management easier.

EASD 2020: Is Cycling Good For Diabetics?

I posted this Tweet based on one of the presentations at EASD 2020.

It is worth going through some of the details because it seems incredible that as little as one hour a week of cycling really reduces all-cause mortality by more than 20% in diabetics. It is also a great study to see the limitations of research and statistics. As usual, if you want to cut to the chase, head on over to the tl;dr section.

Details of the Study

Presented by Mathias Ried-Larsen, data was taken from the “European Prospective Investigation into Cancer and Nutrition” (EPIC). This is a massive study across 10 European countries with over half a million participants looking at factors such as diet, environment, lifestyle, and chronic disease.

They took the data and filtered it to people with diabetes at the start of the EPIC study and for which relevant data had been recorded. This brought the number of participants down to 7,513 of which 63% were confirmed to have diabetes with the others being self-reported. A second cohort was considered at the second examination point to see how a change in cycling habits changed mortality rates. This second group comprised of 5,506 people.

The forms of mortality looked at were all-cause mortality (dying for any reason) and cardiovascular mortality (presumably because it is a common killer and one which is a higher risk in diabetics).

Looking at other factors of the diabetes group, it was seen that the participants were mostly middle-aged and overweight, and most did no cycling at all.

Despite the shrinking cohort numbers, they still obtained the graph I tweeted.

The bars on the four points can be thought of as the error in the value (with this level of error we are 95% confident the value is correct, equivalent to a p-value of 0.05 and is considered statistically significant). So, for example, if I do between 1 and 59 minutes of cycling in a week, my risk of all-cause mortality (ACM) drops to somewhere between 60% and 95% of the baseline risk.

The presenter claimed the covariates (other factors we know about the people) were statistically removed from affecting the numbers attributed to the cycling. So, for example, given women generally live longer than men, this could have an effect on the results so this was accounted for when looking at the results.

The presenter further claimed that there was a j-curve relationship with the data i.e. the benefits are reduced at the 300+ minute mark. To explore this, rather than bucket the cycling times into four groups, they looked at the cycling times as they were i.e. a continuous spread of values between zero and nine hours of cycling per week.

While there is a curve with a maximum benefit around 4-5 hours, there is a fairly wide error margin (UCL = Upper confidence level, LCL = Lower confidence level i.e. the upper and lower values with a 95% confidence of being right). In other words, while the curve seems to head up after five hours, the error means it could just as easily be heading down to between 0.6 to 0.7. Similar results were obtained when cardiovascular mortality was specifically examined.

Next was the review of the effect of changing cycling habits.

The takeaway here is starting to cycle yields at least a 10% reduction in all-cause mortality while maintaining a cycling habit reduces risk by between 20% and close to 50%. For cardiovascular risk, maintaining a cycling habit had slightly better results with the risk reducing by 30-60%.

Recognised Limitations

The presentation did talk at some of the limitations:

  • Confounding factors: As mentioned they looked at the influence other factors, such as age and smoking had but claim their results still stand
  • Medication: There was no information on the medications being used by the diabetics and the effect they would have on mortality
  • Underlying disease leading to less exercise and more mortality (reverse causation): As with the confounding factors, they looked at the potential influence and ruled it out as affecting the results
  • There was no distinction in EPIC between Type 1 and Type 2 diabetes so no conclusions between the Types could be made but it is assumed the distribution in the study is close to the general population and, therefore 80-90% of the cohort was Type 2

tl;dr

For middle-aged Western European diabetics, the study showed:

  • Cycling reduces all-cause mortality and cardiovascular mortality
  • The level of benefit is harder to quantify but, the best benefit was shown to be at around 4-5 hours per week of cycling where the reduction in risk was roughly between 20-40%. Additional cycling may be of benefit but the error margins were too high to confirm this one way or the other
  • Starting a cycling habit or maintaining one shows benefit with the most benefit being for someone who maintain a cycling habit with the reduction in risk being between 20-50% for all-cause mortality and 30-60% for cardiovascular mortality
  • There was no distinction of Type so it is best to assume these results apply most strongly to Type 2 but I can see no reason why it would be different to Type 1s except for the additional risk of hypo if insulin dependent

EASD 2020: The Benefits of Looping for Children

With more looping systems coming to the market from the major manufacturers, there is more research being done into their efficacy, which is great. The focus of a few presentations at EASD 2020 was the benefit of looping systems for Type 1 children and adolescents. What was very interesting was they all came to similar conclusions. This blog will give a summary of those conclusions. Tl;dr available at the bottom for those who do not want to read the details of the individual studies.

Presentation 1: Glycemic Control Improves Over 4 Month Use of Closed Loop Insulin Delivery in School-Age Children with Type 1 Diabetes

Presented by Dr. Marc Breton.

For this study the t:slim X2 with Control-IQ was used over 16 weeks. 100 children participated between the ages of 6-13 and none had used looping before.

The results were all positive. For Time in Range, there was an improvement over the control group. The control group was one quarter of the participants using a pump with no looping.

From other presentations at EASD 2020, there is evidence to back up the assertion that a Time in Range (70-180mg/dL aka 3.9-10 mmol/L) of 70% or better significantly reduces the risk of long-term complications. I will write about this evidence in another blog but, for now, you will have to take my word for it. As you can see above, the looping nudged the participants into this 70% mark for the duration of the study. The more interesting results were in the Time of Day analysis.

This is a study of Time in Range over the day. Comparing the Control line to the Closed Loop line we see the big difference between midnight and 9am. While there is some benefit over the rest of the day, the loop comes into its own in those early hours, presumably dealing with dawn phenomenon, although the poster did not go into details. We also see a significant narrowing of the variability during the same period as well.

Looking at the baseline measurements, at the start of the experiment compared to 16 weeks later for the control group (SAP) and the closed loop group (CLC) we see significant benefits for looping.

Time in Range (TIR) more than tripled and Time Below Range (TBR) also improved with a similar tripling.

Presentation 2: Nine Months Experience on Hybrid Closed Loop System in Children and Adolescents Previously Treated with Multiple Daily Injections

Presented by Goran Petrovski.

This study used the Medtronic MiniMed 670G over 9 months. The 30 participants were 7-18 years of age. There was no attrition during the study (no DKA, severe hypoglycemia, and no hospital admission) and all participants continued to use the pump (no dropouts).

As with the previous study we had a breakdown, based on the time of day.

A lot of numbers here, and I really need to write a blog on how to read scientific technobabble but, the p-values need to be less than 0.05 to make the HCL value to the left of it statistically significant. So, in other words, all the results were interesting, except for the change in weight.

Interpreting the wall of numbers, SG = Sensor Glucose Average, HbA1c is self-explanatory and TDD = Total Daily Dose (of insulin). As we can see the HbA1c dropped from 8.2 to around 6.8 and remained stable over the 9 months. From my previous analysis, we know keeping the HbA1c below 7% significantly reduces the risk of complications.

While, in the previous study, the benefits were mostly during the night, this was not the case in this study with a drop of around 50 mg/dl (2.8 mmol/L) in the sensor glucose average across the day.

The study also looked at the time in range covering the same ranges as the previous study.

Comparing multiple daily injections (MDI) and Manual Mode i.e. no looping to the looping numbers we see a similar result to the previous study with looping nudging the participants into the all-important 70%+ zone for Time in Range. We also see no increase in Time Below Range with the ground gained coming from the high glucose levels.

Presentation 3: Glycemic Outcomes and the Importance of Active Insulin Time in the Pivotal Trial of the Minimed Advanced Hybrid Closed-Loop System

Presented by Anders Carlson.

As the title suggests, the study used the Medtronic MiniMed 780G, the model up from the 670G. Arguably the biggest difference between the two models is you can set the 780G to the more aggressive target of 5.6 mmol/L (100 mg/dL) compared to 6.7 mmol/L (120 mg/dL) for the 670G. While details of the participants were limited, there were 39 adolescents in the study which went over three months.

Again, as with the previous two studies, time of day numbers were given.

Comparing the Run-in (baseline) to the Study numbers we see that, as with the first study, there was significant improvement in the night-time numbers and a narrowing or variability, especially in the 5.6 mmol/L graph. While the first study looked at Time in Range, this one looked at the Sensor Glucose Average and while there were no ‘unicorns’, a drop of 30 mg/dL (1.7 mmol/L) is nothing to complain about.

For Time in Range, we saw similar results to the previous two studies.

The Time in Range nudged into the 70%+ value with most of the benefit coming from the above-range time.

Presentation 4: First Home Evaluation of the Omnipod 5 Automated Insulin Delivery System, Powered by Horizon in Children with Type 1 Diabetes

Presented by Gregory Forlenza.

This case, as stated it is the Omnipod 5. The 18 children in the study were between the ages of 6 and 14 and participated over three months. There was a slight difference in this study in that different targets for the looping system were also compared.

Again, we have Time of Day numbers with, in this case, different target levels for the looping system.

The red line is for non-looping and the blue line is looping. In this case we do not see a significant shift in the line but we do see a narrowing of the fluctuation in numbers, again, in the first third of the day supporting the notion that looping systems are good for overnight control.

For the table of numbers, anything with an asterisk is statistically significant. From this we can see that Time in Range went from 51% up to over 60% for the lower targets. This is less than the 70% seen with other systems but an improvement regardless (and the presenter was very keen to disclose that the study was done over Christmas). Time Below Range and Time Above Range were both reduced for the lower target settings.

For Time in Range,

we see that 10 out of the 18 children managed to achieve a Time in Range of greater than 70%, compared to 2 out of 18 for the non-loopers.

Also, when the more aggressive target of 6.1 mmol/L (110 mg/dL) was employed, we see the lowering of the overnight blood glucose levels we saw elsewhere and a reduction in high numbers.

tl;dr

Children can benefit greatly from looping systems compared to multiple daily injection or non-looping CGM/Pump setups. Key benefits include:

  • An overall improved Time in Range (70-180 mg/dL aka 3.9-10 mmol/L) with values generally over 70% which is the critical mark to significantly reduce the risk of long term complications. The more aggressive targets (lower than 7 mmol/L aka 126 mg/dL) were the most successful at getting 70%+. Time Below Range was not always affected compared to Time Above Range which was consistently significantly reduced.
  • Overnight blood glucose values were especially improved with looping both in terms of the average sensor glucose and time in range. The variability of the numbers was also improved with looping.
  • The results were largely independent of the looping system employed; the benefits are down to the overall technology, not any one company’s version of it.

EASD 2020: Medtronic’s 7-Day Infusion Sets

As a dedoc Voice I had the privilege of attending EASD 2020 (European Association for the Study of Diabetes annual conference) from 21-25 September. I will be doing detailed posts of some of the announcements from the conference over the next few weeks with this being the first.

For those that use insulin pumps, one of the announcements was the development of a 7-day infusion set by Medtronic, instead of the usual 2-3 day sets on the market today.

They looked at the various aspects of delivery which could affect performance and found that insulin stability and preservative concentration, which dropped over time, were critical factors leading to hyperglycaemia and the need to remove the infusion set.

To address the stability factor, they changed the reservoir cap to alter the flow (fluid dynamics can play havoc with insulin stability, apparently), changed the tubing material to help preserve the preservative, and improved the patch adhesive so it would last longer.

Once the new design was created, 20 participants wore the infusion sets for a month (four in total for each person).

The graph in the middle is the key piece of information here.

The y-axis is survival percentage (how many infusion set were still working) and the x-axis is the days of wear. The green line is the usual 2-3 day infusion set and the purple line is the new infusion set.

To reach the point where 20% of the infusion sets had failed (80% survival) took the new infusion set seven days, compared to, unsurprisingly, 2-3 days for the 2-3 day infusion sets.

One of the claimed incidental benefits is the saving of insulin left in the tubing and reservoir (as well as insulin wasted in priming) which, according to Medtronic, could account for as many as 5-10 vials of insulin per annum. With insulin pricing being what it is in the US, it is easy to see how this is compelling. Given the system also needs a special reservoir, I am hoping the costs to the tech do not outweigh the savings in insulin.