Most diabetics, certainly most Type 1s, know their HbA1c. As described previously, the HbA1c is a measure of the ‘average sugariness’ of the blood over the last three months. As a diagnostic test, the HbA1c has been with us for a little over 40 years and has served us well. However, as technology has improved for the management of diabetes, the ways we keep tabs on our blood has also evolved and a new measure: Time in Range is growing in popularity among both diabetics and researchers alike. In fact, quite a few talks at EASD 2020 spoke directly at Time in Range and linked it to the long term health of diabetics.
In this blog I will talk about what the HbA1c tells us, its limitations, and the additional insights we can gain through the Time in Range. As usual, at the end, we have the ‘Cliff Notes’ tl;dr.
Benefits of Measuring the HbA1c
As I have shown previously, many papers examine the relationship between long term HbA1c and complications and this was reiterated by Professor Pratik Choudhary at EASD 2020 with this excellent graph.

The Limitations of the HbA1c
While of diagnostic value, there are limitations with the HbA1c measure.
Firstly, the measure assumes the lifespan of the red blood cells as part of the calculation so, if this assumption is invalid, it can affect the HbA1c. Common causes of false HbA1c readings include:
- Anaemia
- Excessive alcohol consumption
- Excessive use of opiates
- Pregnancy
- Blood transfusions
The second and arguably biggest limitation of the HbA1c measure is while it speaks to the ‘average sugariness’ it says nothing of the variation. This is why, historically, doctors have erred on the side of a higher HbA1c with Type 1s, often to the diabetic’s frustration. The reason is simple: if the diabetic’s glucose levels fluctuate significantly, and they keep a lower glucose level, they are at an increased risk of hypo whose effects are immediate (groggy, fall over, go unconscious etc.) whereas running a little ‘high’ and fluctuating mitigates the risk of hypos at the expense of increasing the risk of long term nerve damage. To put it simply, with limited visibility of the fluctuations using strip glucose monitors, it makes sense that doctors err to minimize risk today and encourage their patients to run a little higher with a view that the longer term risks can be managed later.
Interestingly, in his talk, Professor Choudhary blamed his patients for running high and having high fluctuations, suggesting they are driven by fear of a hypo which then leads to over-correcting and large fluctuations.
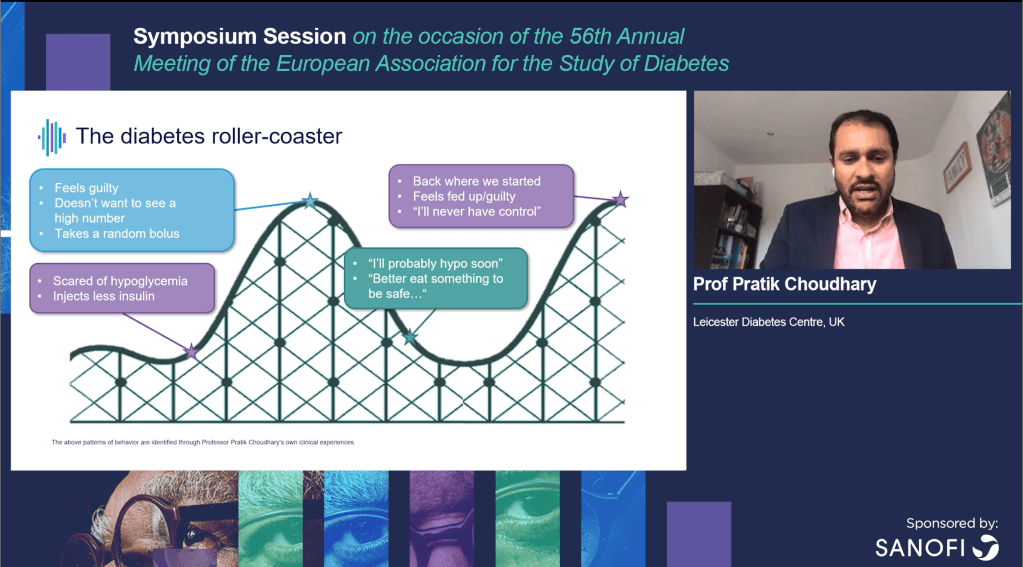
Fortunately, Continuous Glucose Monitoring (CGM) technology gives a much clearer picture of the fluctuations, informing both the doctor and patient, and allowing them to proceed informed, rather than out of fear.
Time in Range
It has taken a while for a standardization of Time in Range guidelines but in August 2019 we got one from the ADA.
The standard is adjusted for various sub-groups of diabetics.
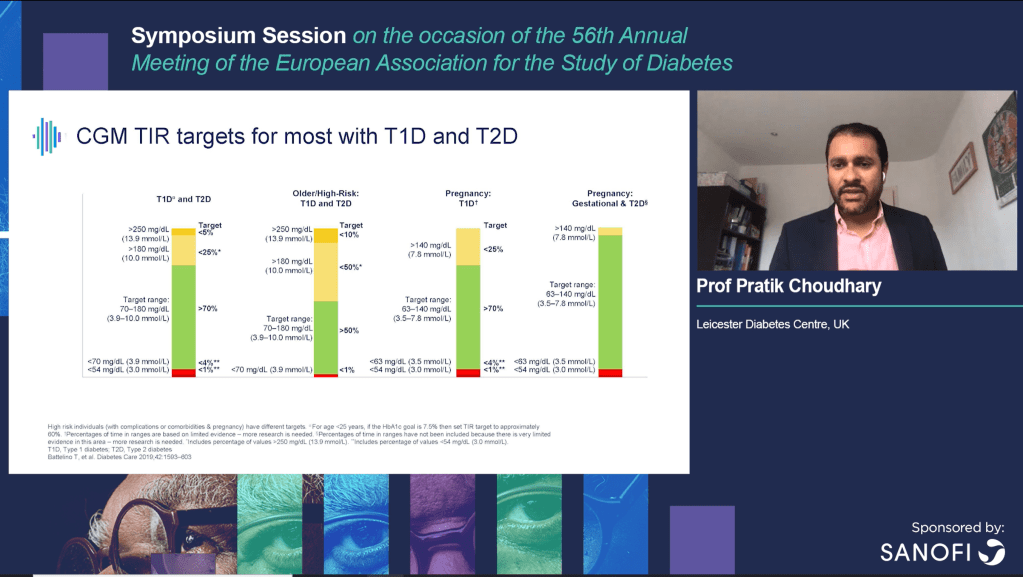
What is more, these ranges are not random, or at the whim of some group of doctors, but backed up by statistically significant links to both long term complications and the equivalent HbA1c.
Some of these were highlighted by Professor Richard M. Bergenstal.
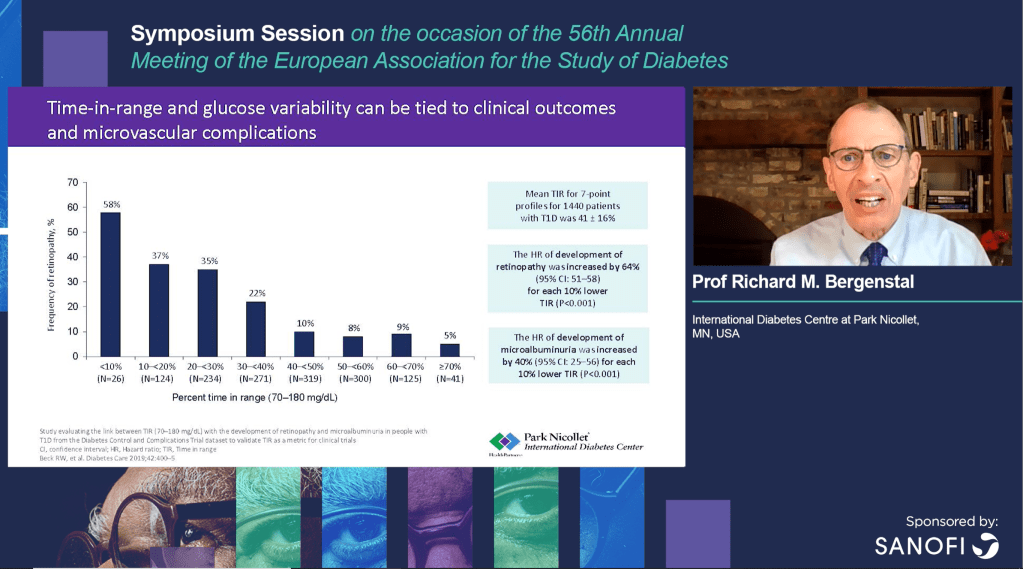
and Anass El Malahi at EASD 2020.

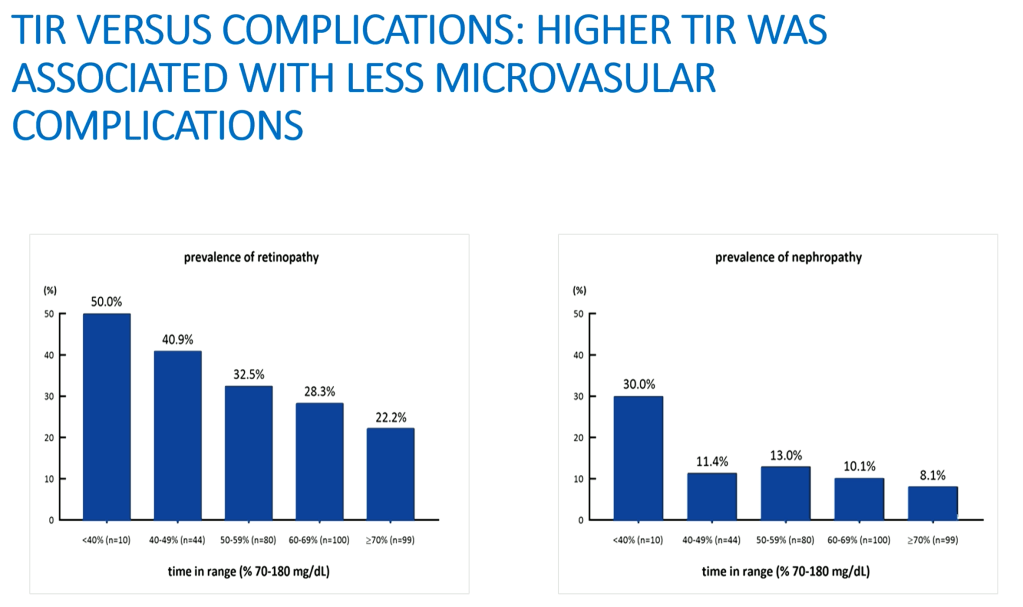
As we can see, we can link changes in Time in Range to changes in the risk of retinopathy, microalbuminuria, microvascular complication, and nephropathy.
Professor Bergental also showed, using the CGM data of three of his patients, how much more insightful Time in Range can be, compared to HbA1c.
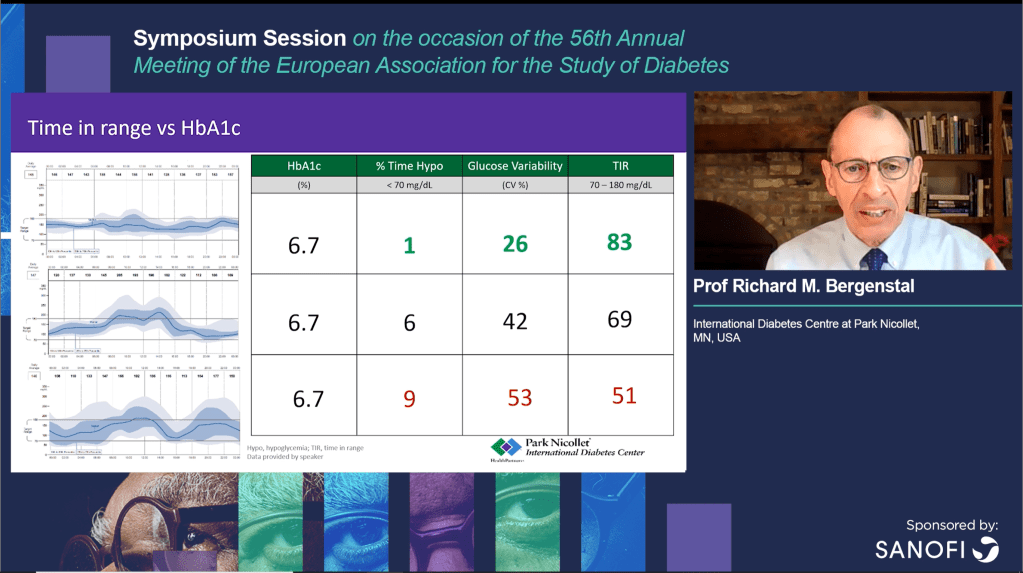
Here the three patients have exactly the same HbA1c but very different experiences with their diabetes. with the third patient spending a lot more time in hypo and much less time in range.
Bringing together the Time in Range with the latest data on what it means for long term complications, the Ambulatory Glucose Profile (AGP) Report captures the key metrics along with statistically significant guidelines in one page.
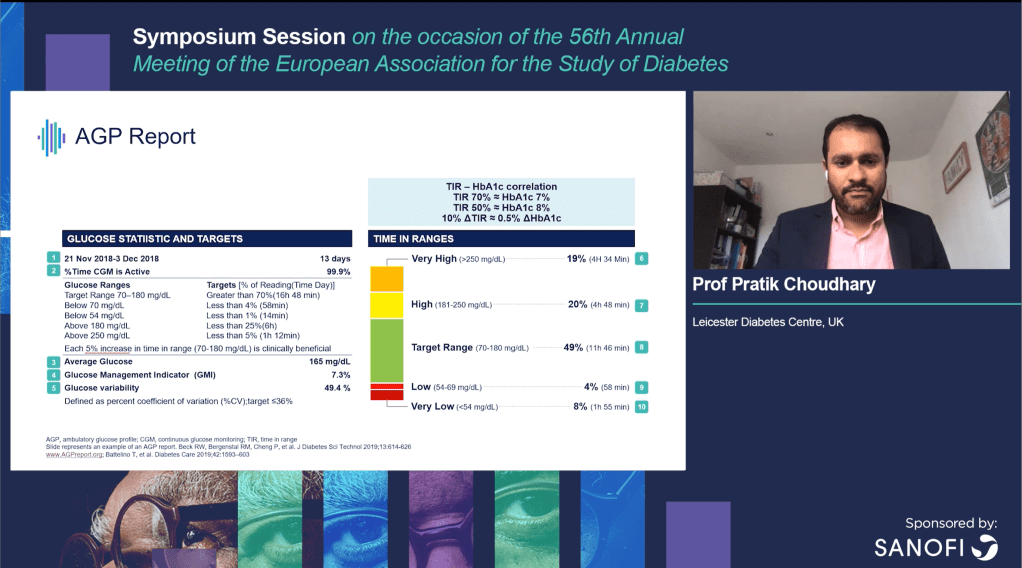
As we can see the report captures:
- Percentage time in the different BGL ranges
- Average Glucose
- Glucose Management Indicator (GMI): an estimation of the HbA1c
- Glucose variability: a measure of fluctuation
which, given the GMI on its own is a proxy for the HbA1c, shows we are considering a lot more information in the AGP report than simply ‘average sugariness’.
The Big Problem with Time in Range
The big problem with Time in Range analysis is it requires a Continuous Glucose Monitor (CGM) to capture the data: it is a metric of privilege. While many of us have no exposure to it in the West, in places like Mexico, some Type 1 diabetics are given literally one strip per day to manage their blood glucose levels. Fortunately, research shows the proportion of finger pricks in, below or above range can still be correlated to HbA1c estimations and, therefore, give an indication of long term risk.

Also, with an increase in Time in Range of 10% leading to a lowering of HbA1c of 0.5%, using the above, we see that for someone whose finger pricks are in range 70% of the time, this correlates to an HbA1c of roughly 7%, as with the CGM data. This means the AGP Report and the guidelines it contains can be applied to CGM or finger pricking equally. So, while a diabetic’s management technology may change over time, their reporting for their health care team does not have to.
tl;dr
With the advent of Continuous Glucose Monitoring (CGM) we have new and insightful ways of examining our data beyond what is available with finger pricking and the HbA1c. One such way is analysing the Time in Range of our data. Time in Range provides a wealth of knowledge about both average sugariness and the glucose level fluctuations. One way to present this information is with an Ambulatory Glucose Profile (AGP) Report.
While driven by CGM technology, it is possible to use the AGP Report with finger pricking by considering the proportion of results that fit in the low medium or high categories. This now means we have a common report whether we are finger pricking or using CGMs.
Clinical research using Time in Range analysis has also established that it is predictive for a range of long term diabetes complications. This means, Time in Range analysis and the AGP Report are now a viable alternative to the HbA1c and provide much richer insights.

One thought on “Time In Range – The New HbA1c”