My perspective on managing diabetes is it requires a multi-faceted approach. I refer to the strategic elements of this approach as ‘levers’. The way I see it, it is a case of working out how hard you can personally pull each lever and which ones work for you.
What are your Goals?
Before a strategy can be put in place, we must have an idea of where we are heading, what are our goals? These can be big, hairy audacious goals (I want completely normal blood sugars) or smaller ones (I want to reduce my HbA1c). With goals in mind, we can start to use the levers to get us there.
My goals are:
- Minimise daily management to avoid burnout
- Reduce my HbA1c to a point where my risk of long-term complications is no more than 2x baseline
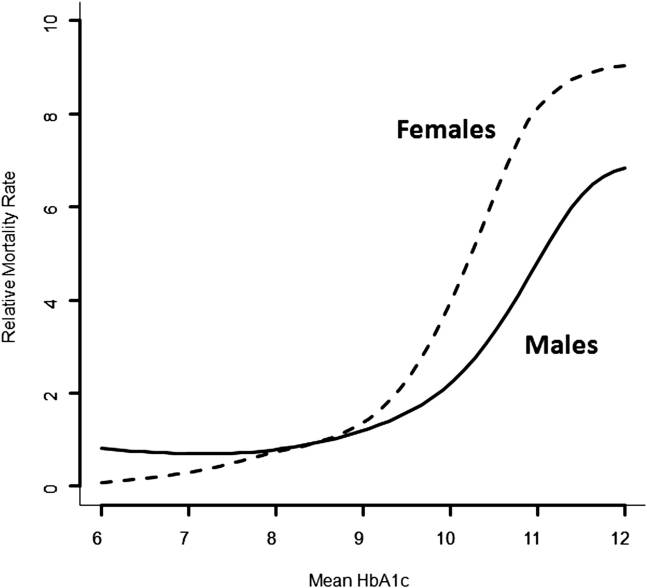
That’s it! Goals do not need to be complicated and, in my case, one is qualitative (minimise management) and the other quantitative (based on my previous blog, getting an HbA1c under 7.0% is good, getting under 6.4% without hypos is better).
What External Factors Can Hinder Us?
In moving towards our goals, there are factors which may impede our progress. T1D Mum provided this great summary of “social determinants of health” which impact our lives.

While ‘Individual Lifestyle Factors’ speaks directly at the levers I am referring to, as we more further out, our ability to influence the impact on our lives becomes harder e.g. ‘Water and Sanitation’ without significant upheaval to our lives e.g. changing one’s job/home/country or, as t1d mum suggested through advocacy and demand for change. Perhaps we should include advocacy as a lever to address this although it is a slow moving one.
Levers You Can Pull
I brainstormed as many levers as I could think of and went to social media to see what other levels people could come up with.
These are the ones the collective came up with in no specific order:
- Food
- Sleep
- Exercise
- Medication
- Technology
- Health Care Team
- Social Media and Online Resources, and Peer Support (care of Tim Street)
- Family, Friends and Allies (care of Tomorrow’s Gone)
- Time and Financial Status (care of Mary Murphy)
- Stress/Wellbeing/Mental Health (care of Asra Ahmed and Mike Ratrie)
- Education (care of Dave Dikeman)
Let us go through them.
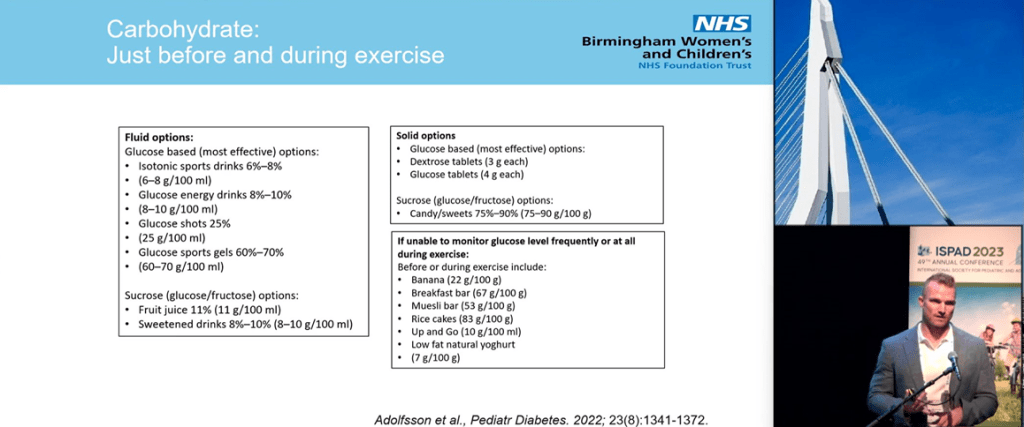
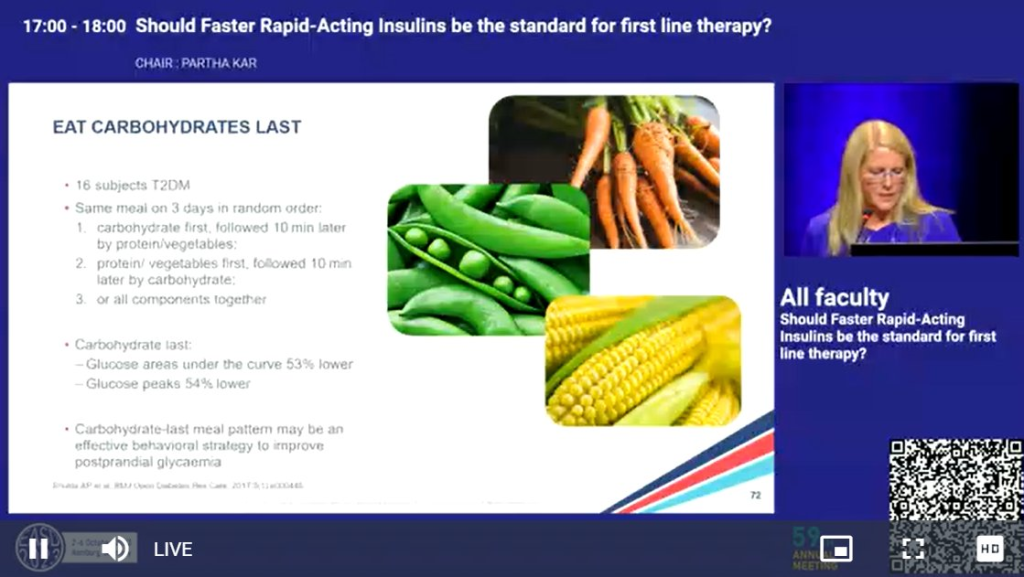
Food
Arguably the lever which gets talked about the most and possibly one of the easiest to pull in some fashion. Clearly, reducing the amount of fast-acting carbohydrates will help with blood sugar spikes but, after this, we may adopt a different approach, based on our goals, beliefs, and social context.
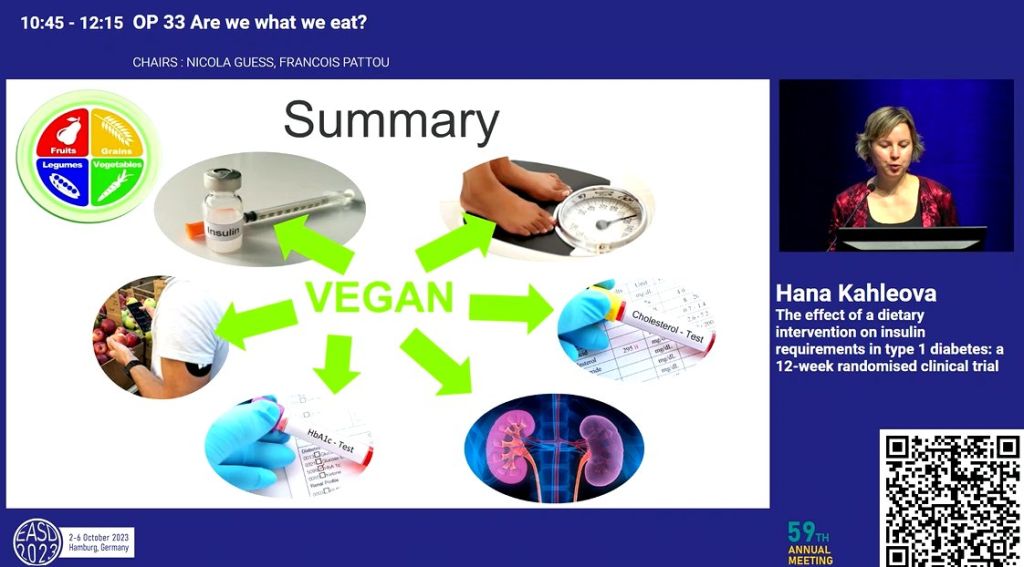
For some, a ‘carnivore’ approach is the way to go given muscle tissue has many of the nutrients our body requires with zero carbohydrates. For others, a plant-based diet which reduces insulin resistance makes more sense.
Given how tightly food in woven into human culture, it is hard to give hard and fast rules about how to pull the food lever which will apply universally. Everyone will have an idea of the changes they can practically make to their diet to steer them towards their goals.
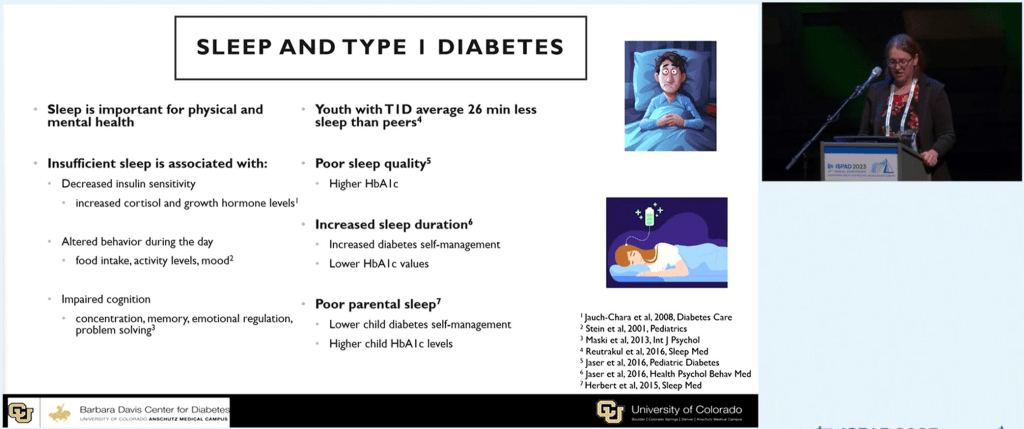
Sleep
The CDC gives a great summary of the benefits of sleep for people with diabetes. The very short version is a good night’s sleep is a relatively simple lever to pull to help you towards your goals. Tim Street correctly points out though that adjusting sleep patterns can have unpredictable effects to basal rates and glucose levels (Dawn Phenomenon) so make changes slowly.
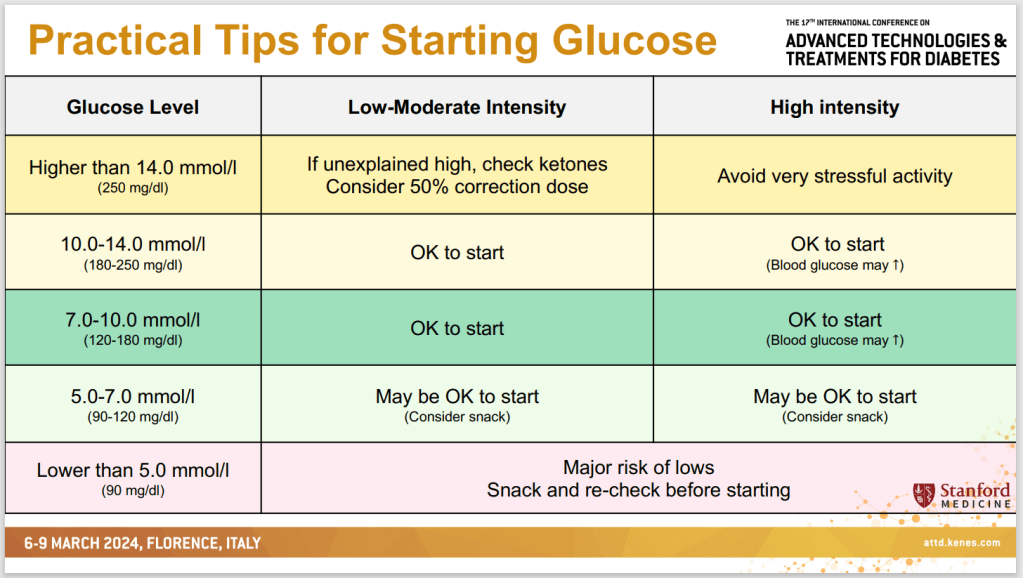
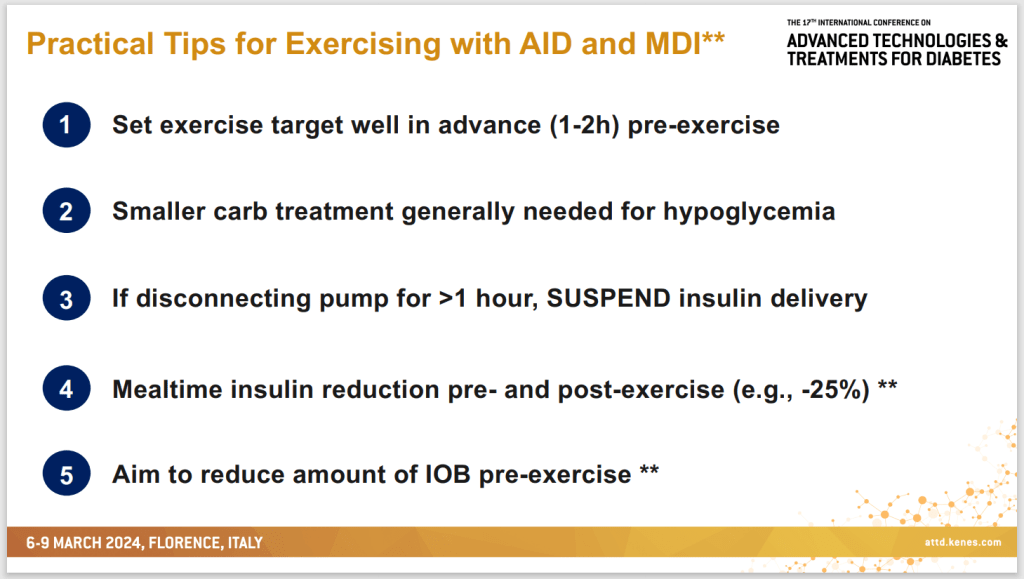
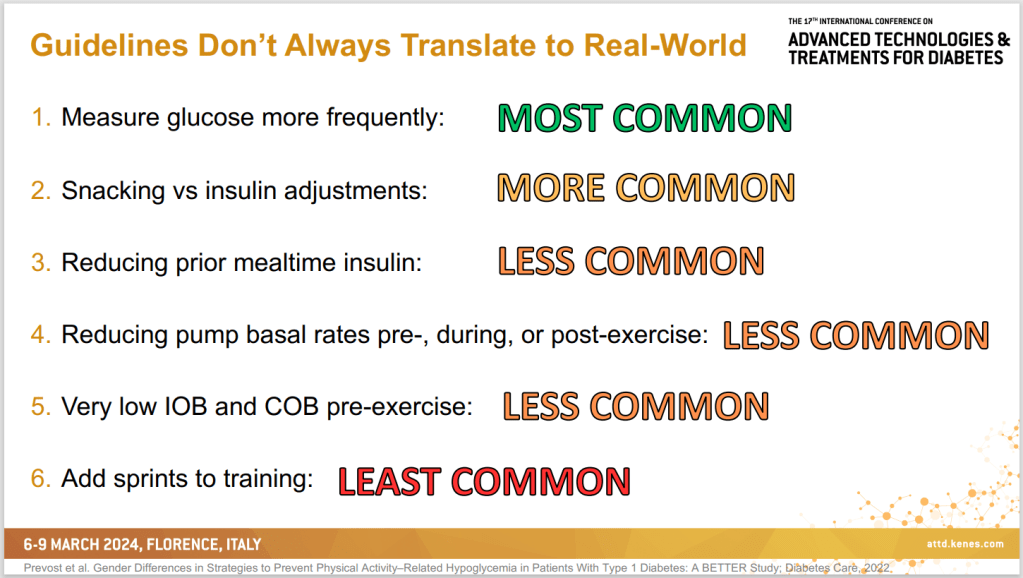
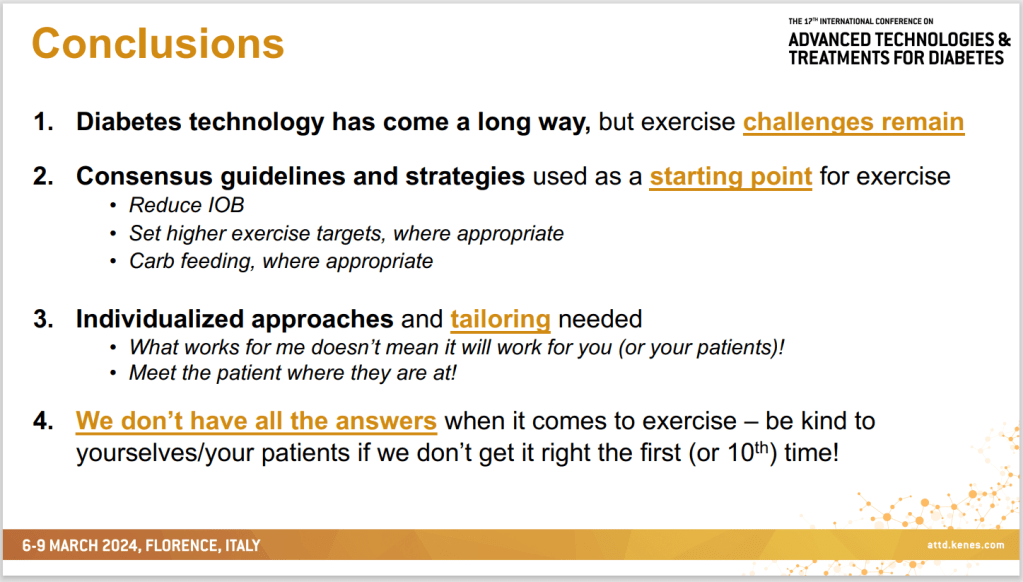
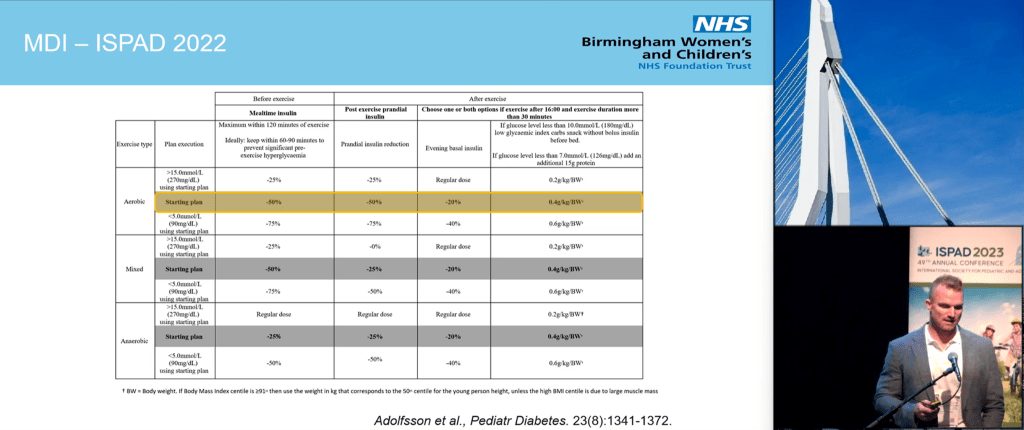
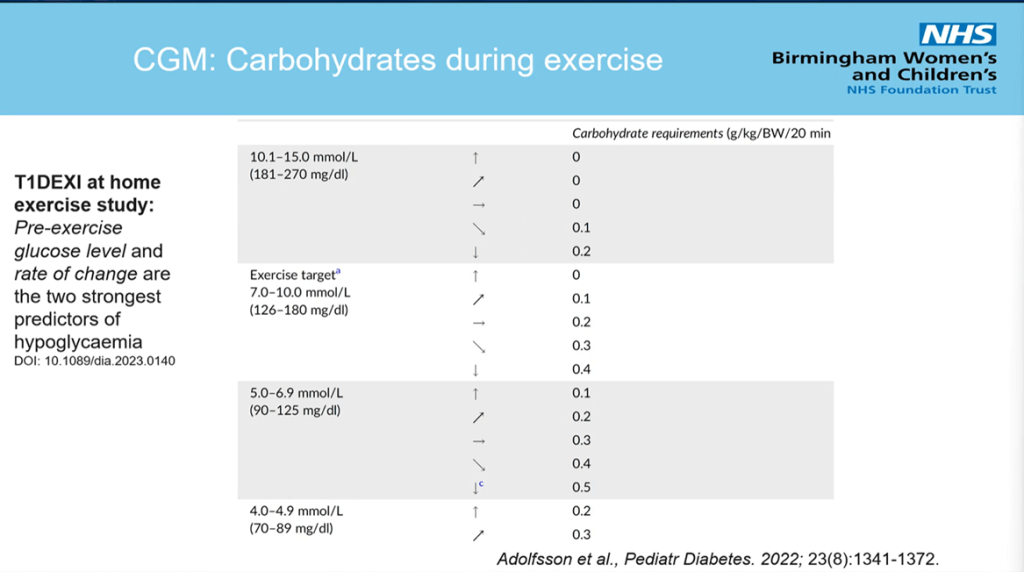
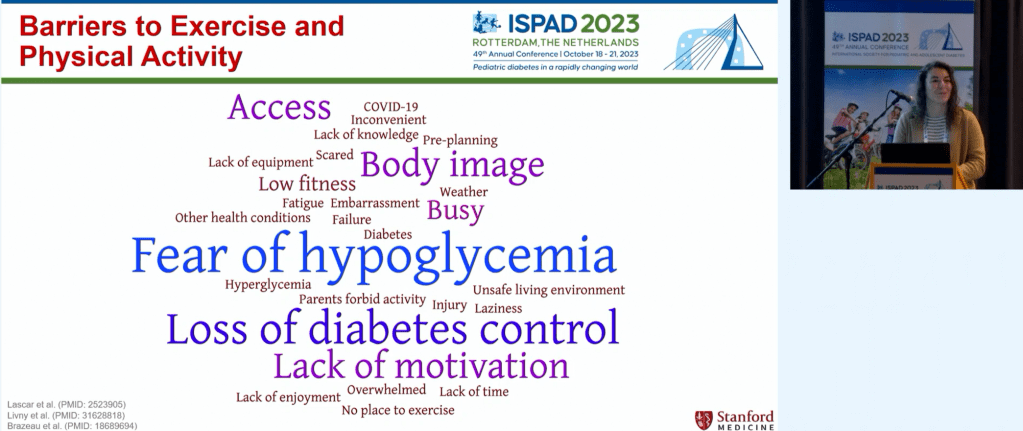
Exercise
It is news to no one that exercise is beneficial to health in general and diabetes specifically. Again, I will pull out Dr. Dessi Zaharieva’s exercise slide to summarize the benefits.

Medication
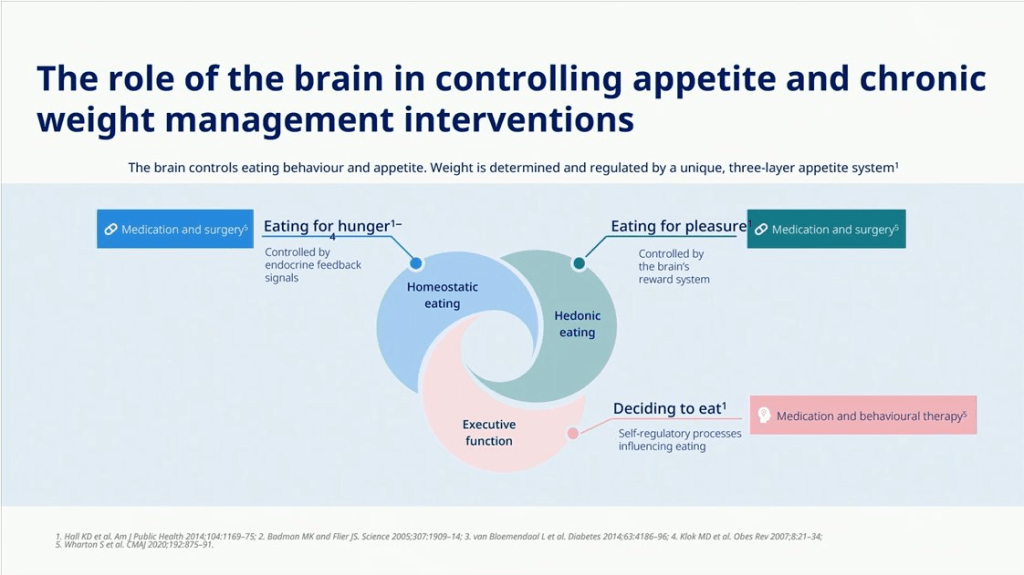
Gone are the days when the only medication for diabetes was insulin. We now have drugs which reduce insulin resistance (Metformin), actively remove glucose from the blood (SGLT2is), and restore the satiety response (GLP1s) as well as many others and many more coming.
It may not be a lever any of us relish pulling but it is there for us to use as we see fit.
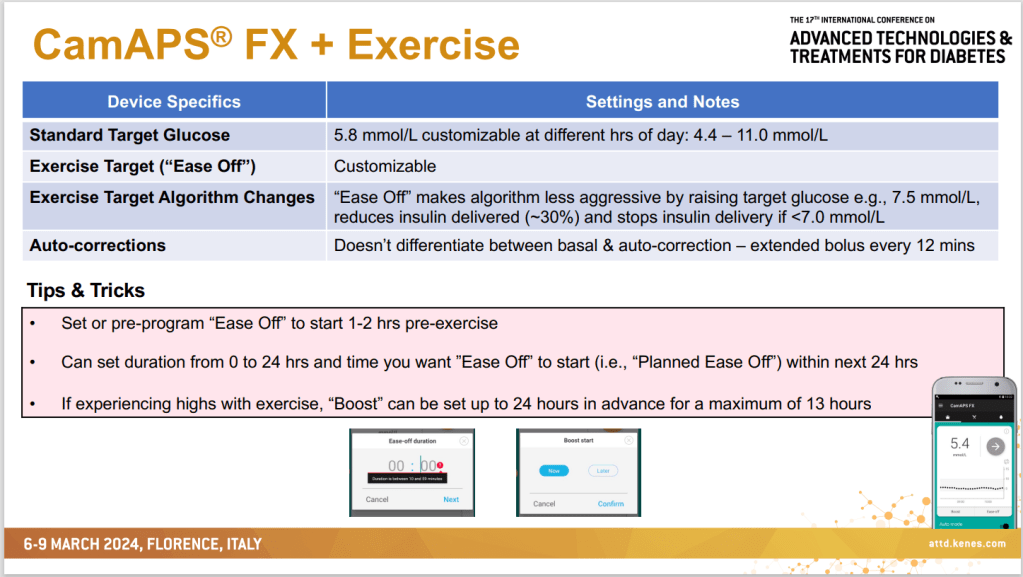
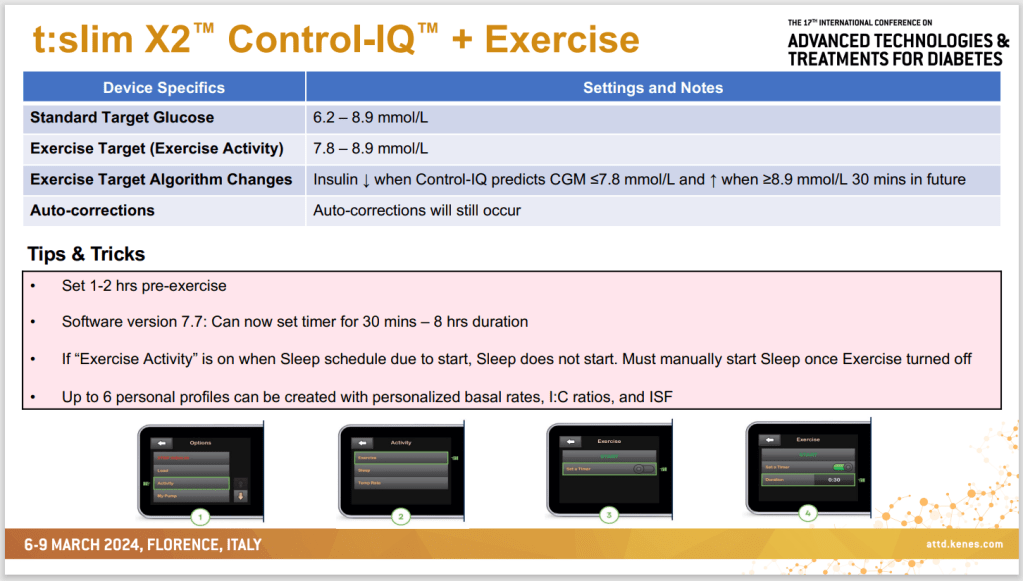
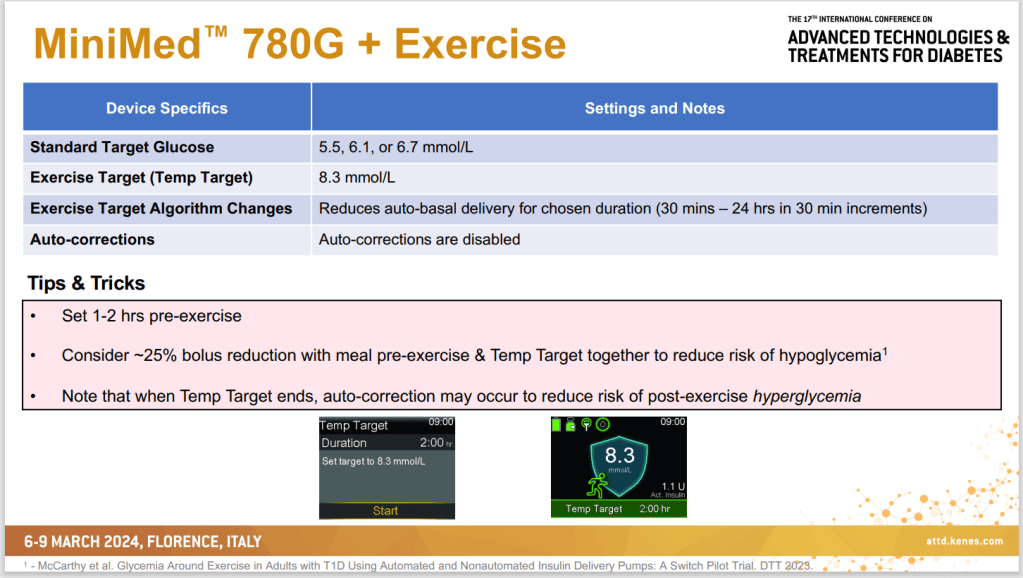
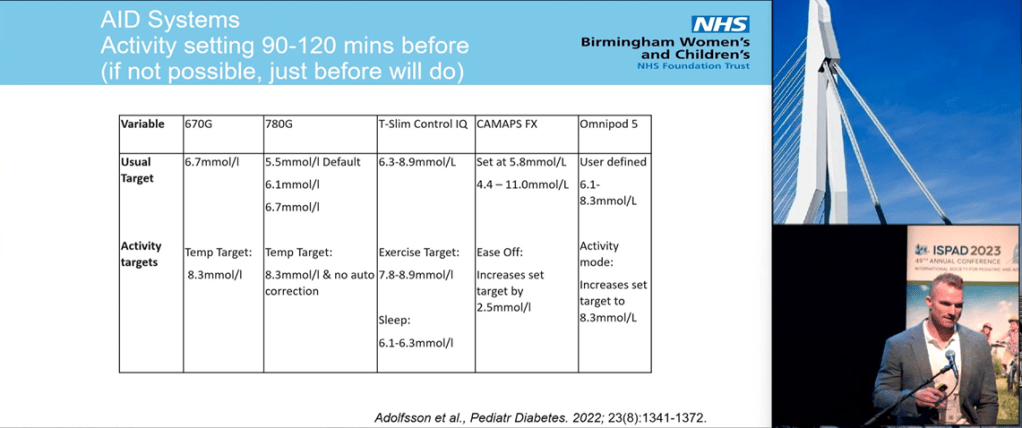
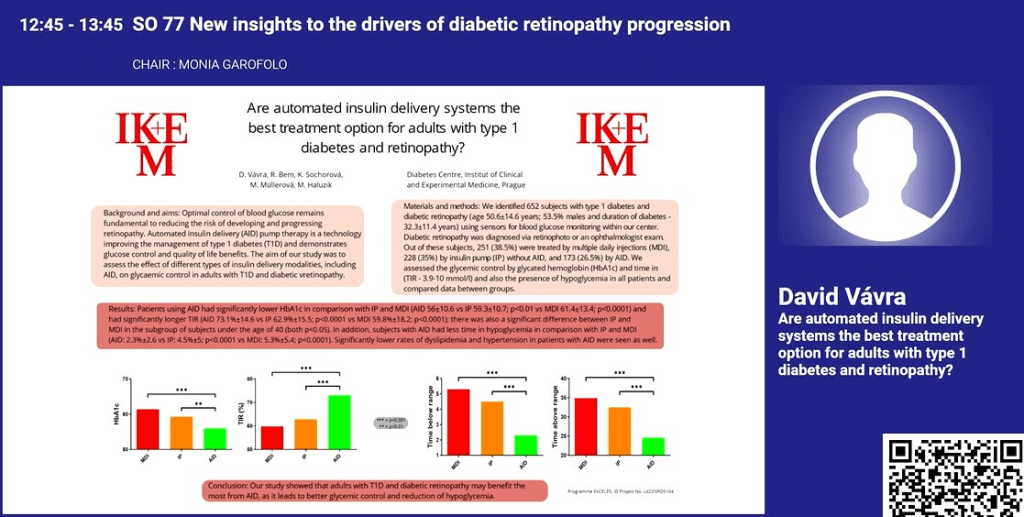
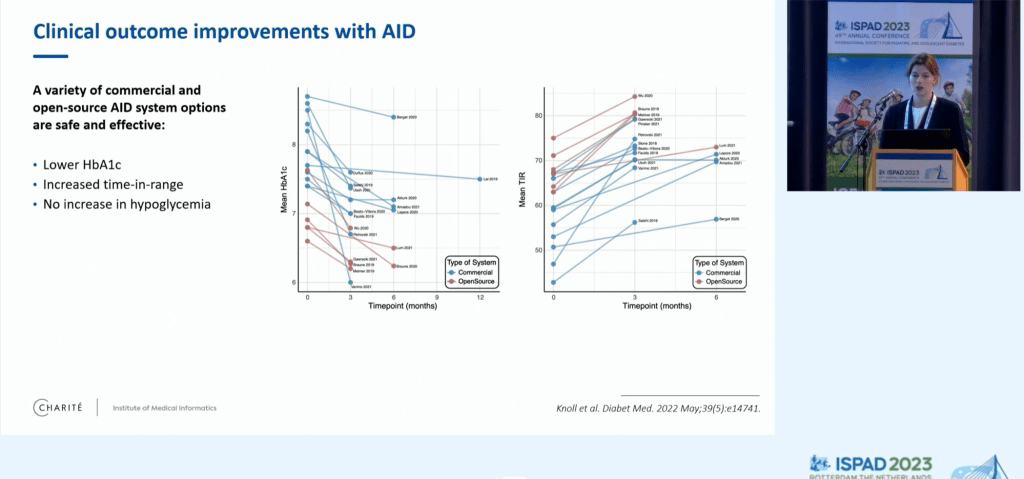
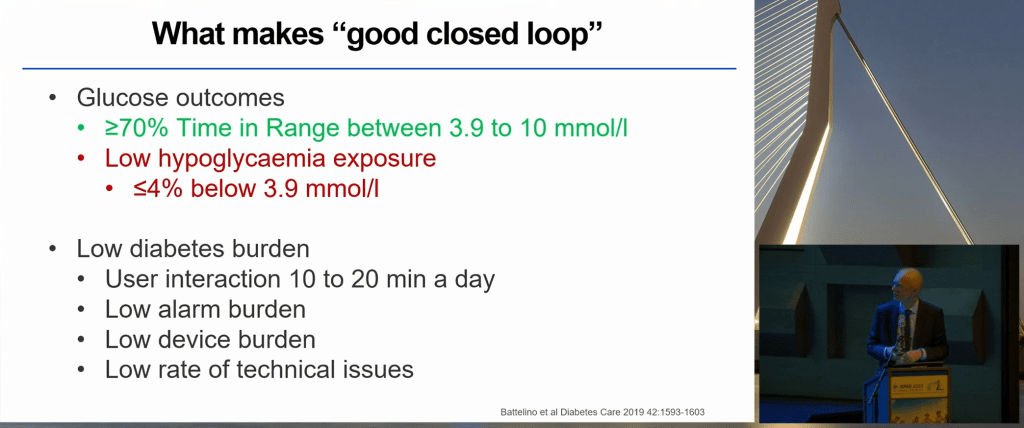
Technology
Even in the seven years since my diagnosis, technology has progressed significantly and continues to do so. We now have commercial looping systems which act as an artificial pancreas and, while not perfect, they can provide tremendous benefit in managing, for example, overnight levels.
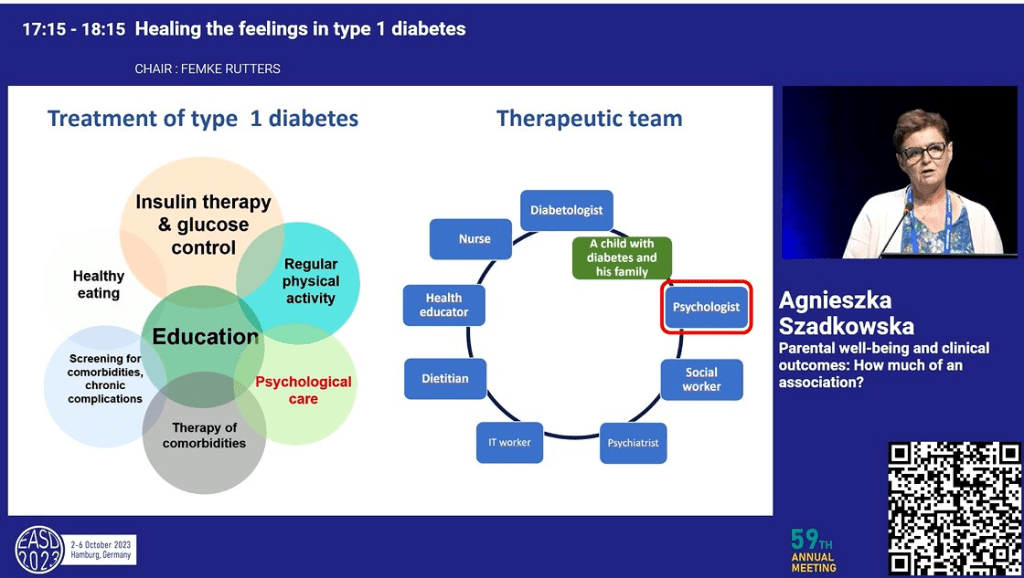
Health Care Team
A good health care team is vital for good management. They act as a source of expertise as well as a sounding board for your own thoughts and discoveries. The ability to engage with the health care team or adjust its composition varies greatly from, for example, rural to urban areas which can limit how much this lever can be pulled and how effective it is.
Social Media, Online Resources, and Peer Support
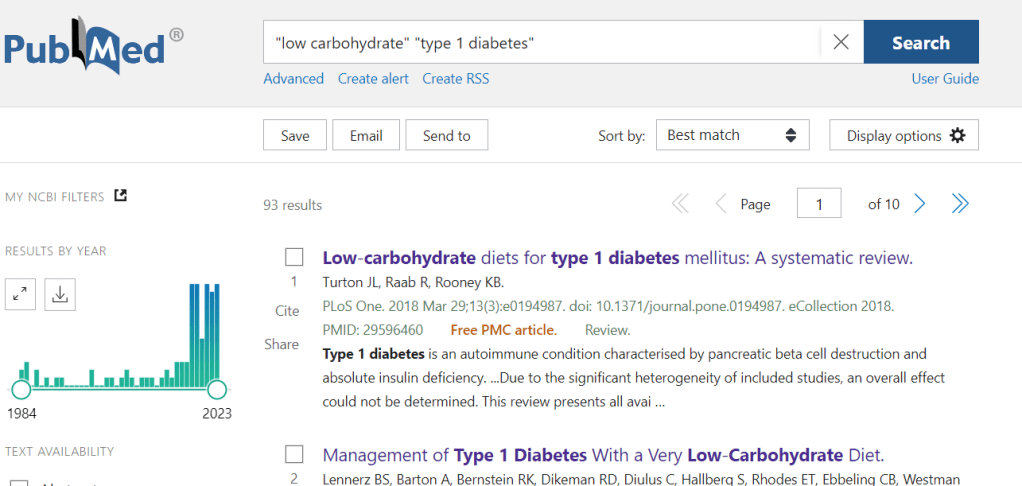
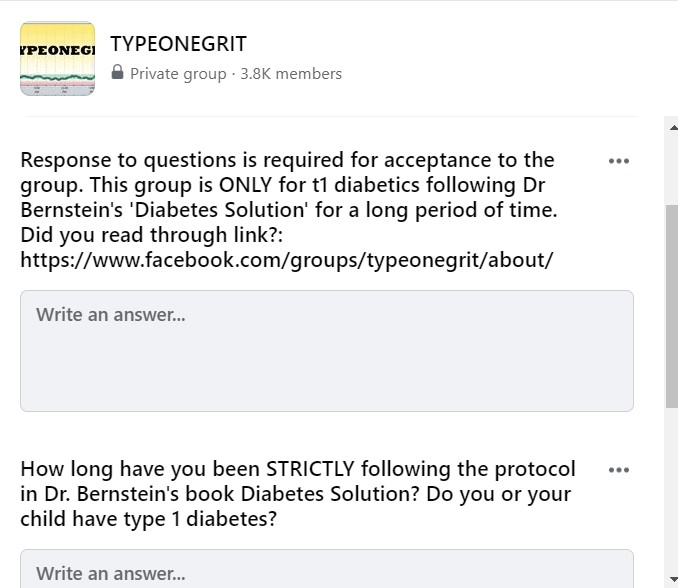
Another resource for information and ideas, social media, online resources and peer support, like the health care team should be carefully curated so they work for you, rather than against you. Unlike the health care team, a lot of what is found online is unregulated so, even more than the health care team, critical thinking is needed to work out what is useful, what is unfounded, and what the agenda is behind the information. For example, I trust PubMed much more than medical ‘evidence’ from Twitter or Facebook. However, in terms of looping and success in managing LADA, online discussion groups have been essential. As Tim Street puts it “Peer Support…opens minds to methods that may help…”
Family, Friends, and Allies
Online support is one lever but support in the real world is another we can pull. As Tomorrow’s Gone suggests, having family and friends who are ‘followers’ to CGM data, who can help out on sick days, tell you when dinner is going to be ready so meals can be effectively managed, or do supply-runs when they unexpectedly run out is a great asset to have. Tomorrow’s Gone also mentions making allies of others such as the school a person with type 1 diabetes attends by providing a care plan.
Financial Status
There is flexibility in money and, therefore, financial status can greatly impact our success in managing diabetes. It is also one of the hardest levers to pull given the inherent expense in managing diabetes and the financial commitments of everyday life e.g. we may want to use certain technologies or medications but cannot afford them. Therefore, getting financial advice and stabilising finances with a budget can be a great lever to pull.
Time
As we can plan our finances, so too we can plan our time and give ourselves flexibility to explore other levers such as exercise or sleep. While none of us want to be a slave to a strict time regime, some planning and organisation can provide benefit.
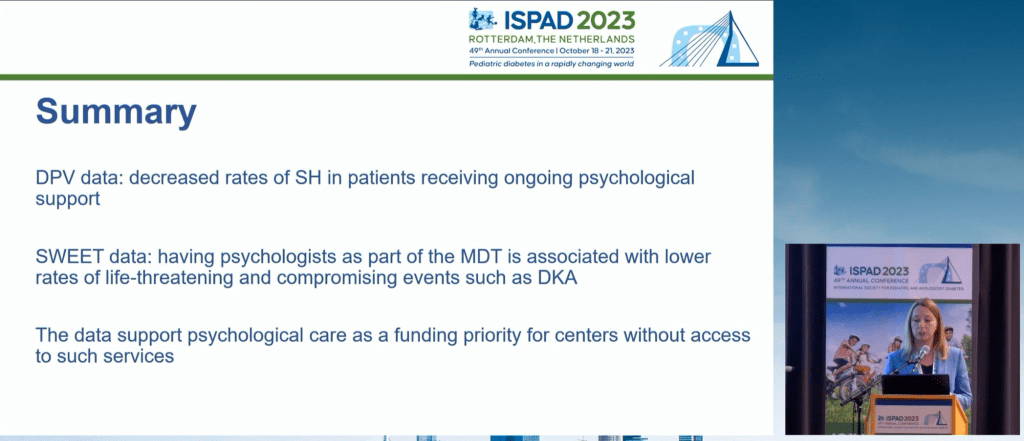
Stress/Wellbeing/Mental Health
Stress hormones can cause havoc with blood glucose levels and maintaining good mental health is vital to keep the diabetes gremlin in its cage. Whether it is doing something relaxing such as meditation or yoga, or regularly seeing a mental health professional, there are ways we can keep our mind clear to tackle the demands of the body.
Education
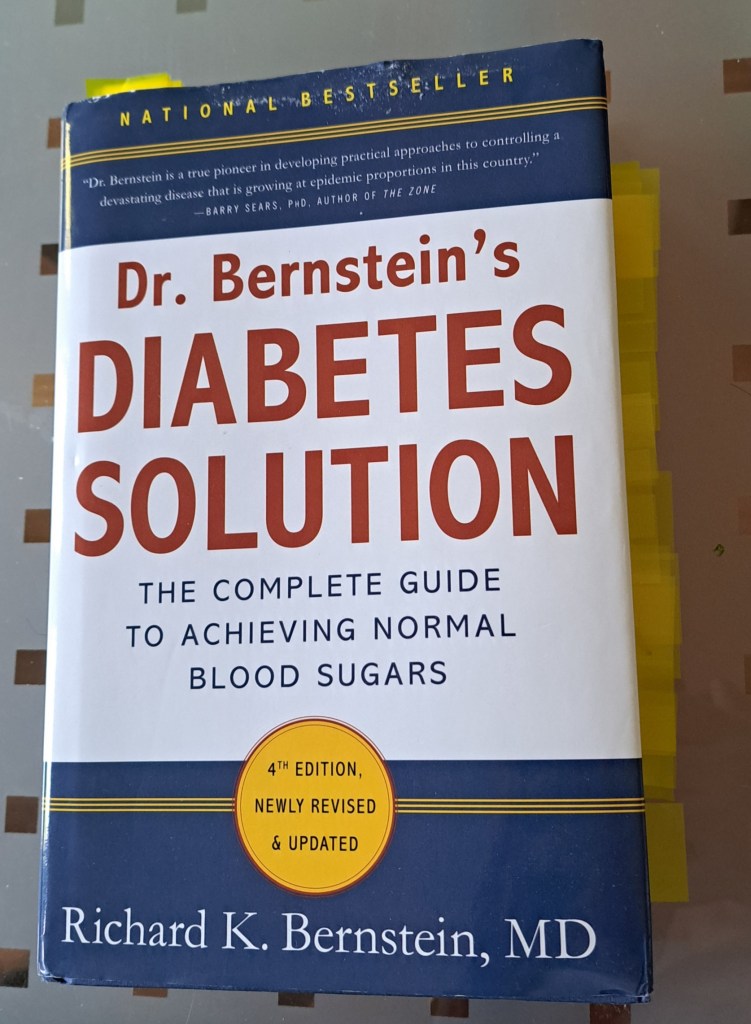
This arguably overlaps with some of the other levers such as having an effective health care team and making good use of online resources but, as it also covers physical media such as books or university courses, I have called it out as a distinct lever.
Also, you are your best advocate in managing this disease. You know your body better than anyone and have the greatest motivation to keep you healthy. Arguably, this can only be done if you are educated about your body, about diabetes, and about the levers you intend to pull.
Education regarding your own body is an interesting one because this knowledge can only come from self-experimentation and not from the internet, a book, or a university. Dave Dikeman mentions practical knowledge of insulin dosing as an example which is vital if manually injecting and can be quite individual, depending on insulin resistance and diet.
Education can come from a variety of sources, such as those mentioned, and, for me, empowers and amplifies many of the other levers available.
No Lever Acts in Isolation and Levers can be Inconsistent
As you read through it may have occurred to you that some levers affect others, as mentioned with education. Also, levers may not always act the same way. For example, with a women’s monthly cycle insulin resistance can significantly change, affecting the way insulin, food, and exercise impact the body.
For this reason, I believe there is not one lever which is more important than any other and over-reliance on any one lever can set us up for failure. For example, an over-reliance on technology means we may be in big trouble if it fails. Using diet, being educated on how to inject safely as a backup, and having a robust support network means we have contingencies if technology fails. As Steve Norris sums it up “I think the problem is that the levers don’t pull consistently, nor do they act in isolation. A holistic, yet unburdened, approach is important…”