My first review was on Very Low Carbohydrate Diets (<50g carbohydrate/day) so if you are interested in ketogenic diets that is the literary (literature?) review for you. This review looks at academic papers researching Low Carbohydrate Diets (LCD, 50-130g carbohydrate/day). This is the area I generally aim for and, with looping, I have had success, bringing my HbA1c down to 5.6% i.e. within the non-diabetic reference range.
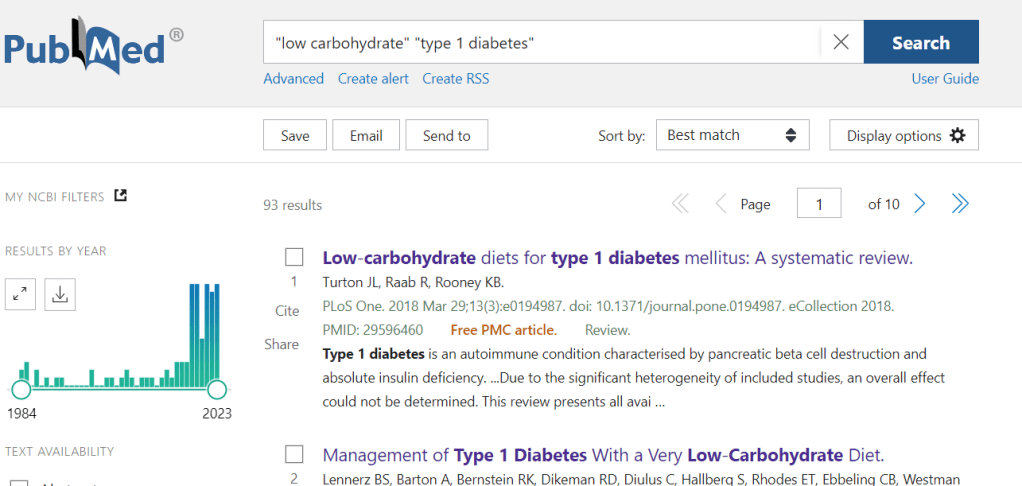
As before, I used PubMed and exactly the same search string as before. The difference was, in this case, I reviewed the 93 returned results, looking specifically for Low Carbohydrate Diets, not Very Low Carbohydrate Diets. As before, I only selected papers where the full publication was available and a quantitative group study of some kind was involved. The subjects also had to be human, not rodents etc.
Want to cut to the chase? Go straight to the tl;dr section at the end.
I plan to do a third review of plant-based diets for managing type 1 as well after this one. If there is a specific diet you would like me to trawl the literature for, let me know in the comments.
Brief Recap: Very Low Carbohydrate Diets (VLCDs)
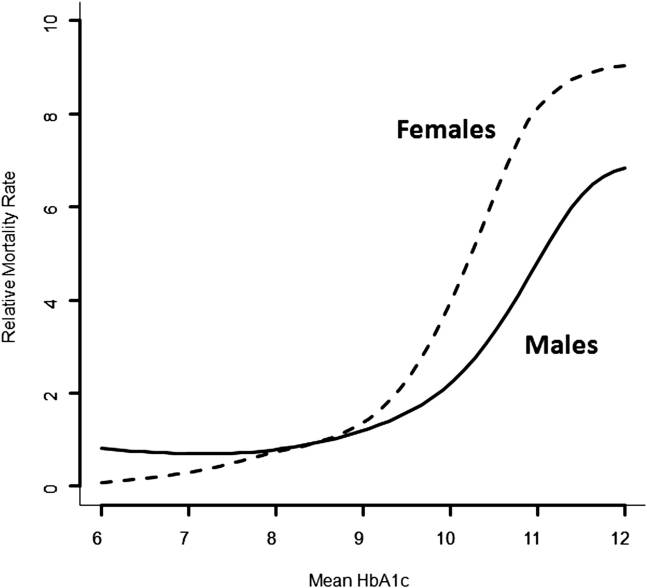
In the previous review, there was no doubt that a VLCD can bring an average person’s HbA1c below 7% and, in some cases in the low 5% range. Whether going significantly below 7% was of benefit was not clear in the data provided by the search but, previously, I have shown that, if the occurrence of hypoglycemia can be controlled, getting below 6.4% will reduce the risk of long term complications.
To counter the clearly positive reduction in HbA1c, a few consequences/risks were also shown in the data which may need to be mitigated/monitored:
- “Oxidative stress” leading to possible organ damage and heart disease
- Glucagon response impairment
- Increased risk of eDKA (euglycemic diabetic ketoacidosis)
and the following table was also provided in one paper in regard to a ketogenic diet (KD).

As mentioned at the time, these aspects do not necessarily outweigh the benefits of a lower HbA1c and many of them can be monitored through regular checks and managed very effectively through the use of things like multivitamins, laxatives, and cholesterol medications.
The question I hope to address in this article is whether an LCD can provide a comparable benefit and whether it still incurs the same risks.
What HbA1c can we expect from an LCD?
For the VLCD, the HbA1c range from the studies was between 5.3% through to 6.8%. The best result I found for an LCD was 6.0% in “Low carbohydrate diet in type 1 diabetes, long-term improvement and adherence: A clinical audit”. This trial looked at 48 people with type 1 diabetes over four years. The average HbA1c change was from 7.6% down to 6.9% but strong ‘adherence’ to the <75g/day (participant decided exactly how much below this level) led to the 6.0% outcome.
Contrary to the VLCD results, this paper reported that cholesterol levels improved on this regimen. However, similar to what we saw in the VLCD diets, after 2 years, half had stopped adhering to the carbohydrate levels specified.
The study also suggested on-going education was vital to keep people on the plan and estimated the LCD was only applicable to about 20% of people with type 1 diabetes, presumably based on the drop-out rate.
The study with the highest HbA1c end point was “A randomised trial of the feasibility of a low carbohydrate diet vs standard carbohydrate counting in adults with type 1 diabetes taking body weight into account”. This study kept the carbohydrates to a strict 75g/day and went over 12 weeks with 10 people with type 1 diabetes. Insulin use went down (which I saw in other LCDs and VLCDs) and HbA1c went from 8.9% to 8.2%, which puts it on a level where the mortality rate is similar to the general population’s but well above the 7.0% and 6.4% targets mentioned earlier. There were no changes to the lipid profile over this time.
Other papers fell between these two extremes. In “A low carbohydrate diet in type 1 diabetes: clinical experience–a brief report”, 24 people with type 1 diabetes were given a diet with 70-90g of carbohydrate/day for 12 months and taught how to bolus for the meals. Hypoglycemia episodes went from around 3 per week to once per fortnight, their HbA1c went down from 7.5% to 6.4%, and cholesterol was mostly unchanged, except for an improvement in triglycerides.
One patient was reported with a final Hba1c of 4.7%, which is extraordinary and, given this is below even what the most dedicated VLCD folks got in the studies reviewed, I am not convinced this was representative of what can be achieved with an LCD.
One other paper reported an improved cholesterol profile on an LCD, specifically, “Changes in the lipidome in type 1 diabetes following low carbohydrate diet: Post‐hoc analysis of a randomized crossover trial”. In this study 10 adults with type 1 diabetes went through either an LCD of <100g of carbohydrates per day or a diet of >250g of carbohydrates per day over 12 weeks. In this case they reported “total cholesterol, LDL and triglycerides had not changed significantly in this trial and only HDL cholesterol was significantly elevated in the LCD arm”
In “The Impact of a Low-Carbohydrate Diet on Micronutrient Intake and Status in Adolescents with Type 1 Diabetes”, 20 adolescents with type 1 diabetes were given 50-80g of carbohydrate per day for 6 months. HbA1c averages went from 8.1% to 7.7%. Not a huge drop and, again, above our mentioned targets of 7% and 6.4%. The paper also recognised the issue of nutrition in adopting a reduced carbohydrate diet saying “The dietician should plan a diet enriched with foods containing soluble vitamins (in particular folate and thiamin), selenium, magnesium, calcium, and iron. Furthermore, we recommend supplementation in a specific quantity, such as yeast extract, Brazil nuts, and Wolffia globose daily. Finally, we advise checking vitamin and mineral blood levels every six months and, if necessary, supplementing daily intake with vitamins and minerals.”
Corroborating this was a paper mentioned in the VLCD review, “The Impact of a Low-Carbohydrate Diet on Micronutrient Intake and Status in Adolescents with Type 1 Diabetes”, which looked at the micronutrient impact of a diet with 50-80g of carbohydrate per day and concluded the diet had the risk of not being nutritionally complete. As suggested before, this could be easily mitigated with a multi-vitamin, supplements, and regular reviews.
Have There Been Studies Directly Comparing VLCDs and LCDs?
It could be argued that, while a list of risks have been identified in VLCDs, a lack of studies looking at these same factors in LCDs does not mean they are not applicable e.g. we do not know if there is an impaired glucagon response on an LCD. There have been some studies directly comparing VLCDs and LCDs to see where the differences are.
In “Low-Carbohydrate Diet among Children with Type 1 Diabetes: A Multi-Center Study”, carers of 624 children completed surveys about the carbohydrate intake of their children with type 1 diabetes. Of these, 36 were following an LCD, and, of these, 5 were following a VLCD. No significant differences were found in the HbA1c levels of the two groups but, again, the VLCD group showed abnormal lipid profiles, specifically, higher total cholesterol and lower HDLs.
In “Physical Activity, Dietary Patterns, and Glycemic Management in Active Individuals with Type 1 Diabetes: An Online Survey”, they deviated from the American Diabetes Association definitions we have been using so far and came up with their own,
- Normal (unrestricted): >200 g/day;
- Moderate: 100-200 g/day;
- Low-carbohydrate: 40–99 g/day;
- Very low-carbohydrate: <40 g/day.
The Low-carbohydrate and Very low-carbohydrate ranges are similar to our LCD and VLCD ranges so I have kept used these for broad comparison. In this case the survey was of 220 people with type 1 diabetes and, of these, around 41 were on a Low-carbohydrate diet and around 27 were on a Very low-carbohydrate diet. As with the previous study, there was no significant difference in HcA1c between participants engaging in Low and Very low-carbohydrate diets. However, of the diets, the Very low-carbohydrate diet was the most predicative of achieving an HbA1c below 7%.
tl;dr
In the literature, LCDs deliver a reduction in HbA1c to somewhere between 6.0% and 8.2%. This compares to around 5.3% to 6.8% for the VLCD. The spread within the range appears to relate to how strictly the diet is followed. In the original review, one paper suggested HbA1c increases by 0.1% for every additional 10g of carbohydrate consumed daily. If we assume a VLCD is roughly 40g/day and an LCD is 100g/day this predicts a range difference of 0.6%. While this roughly matches the results for the lower end i.e. “highly motivated individuals”, it is less predictive for the average participant.
In contrast to VLCDs, lipid profiles (cholesterol) either remained the same or improved under an LCD. However, like the VLCDs, there is a risk that micronutrient needs are not being met with the diet.
When studies directly compared VLCDs and LCDs, there was no significant difference in the achieved HbA1c but, on balance, the evidence suggests, a VLCD has the potential to result in a lower HbA1c than an LCD.
One study suggested on-going education/coaching was important for participants to stay with the diet and I think this applies equally to LCDs and VLCDs.
As we can see there is a mixed bag here. Depending on the HbA1c targets we are pursuing, our concern for our cholesterol levels, and the level of carbohydrate restriction we are willing to tolerate, one approach may be preferable to the other. As mentioned in the introduction I have found success which compares favourably to the VLCD studies with an LCD and technology (looping). I do not see the need to restrict my diet further but, if I saw my HbA1c beginning to rise, a VLCD would certainly be an option. To mitigate the risks of a VLCD/LCD diet I also take supplements and get myself checked to mitigate the risks identified for these kinds of diets e.g. vitamin levels checked regularly.
To this end, my conclusion is, probably unsurprisingly, to follow a similar approach to me. Determine the HbA1c you are looking to achieve and, if you are not achieving it, consider reducing carbohydrate intake as part of your management plan. Small changes can bring you easily into the LCD range and, with the risks identified in this and the previous review, steps put in place to manage them. If you achieve your goals you will, hopefully, have a sustainable plan. If you do not achieve your goals, you can always consider moving to a VLCD although, as identified above, building a supportive team around you to keep you on plan is key because of the high dropout rates for both LCDs and VLCDs.