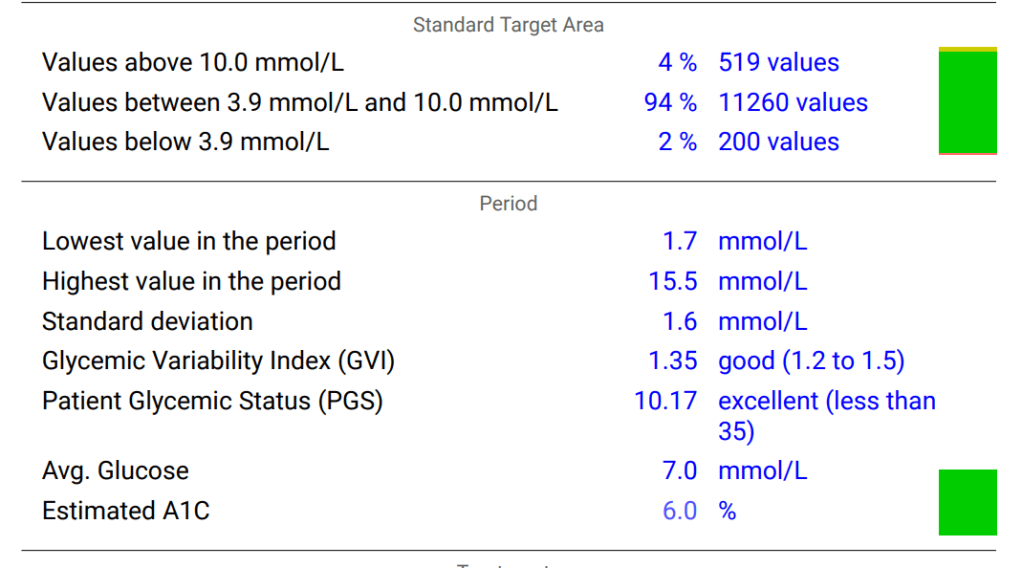
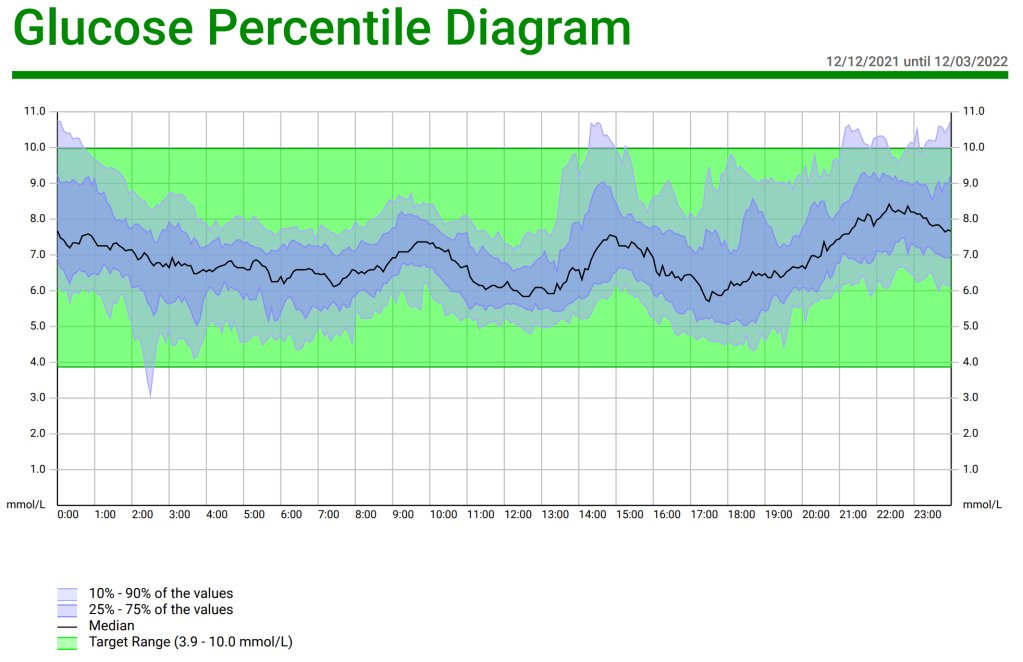
A little over three months ago I started looping with AndroidAPS and I could not be happier; my Time in Range is 90% and my HbA1c has gone from 6.8% and climbing, down to 6.0%. In case other LADAs find themselves in a similar situation to me, with their pancreas slowly failing, and wondering if looping is for them, I thought I would document the journey and confirm it is completely safe. As usual there is the tl;dr at the end for those who want to jump ahead the last page in the book.
September 2021-June 2022: Moving to Insulin
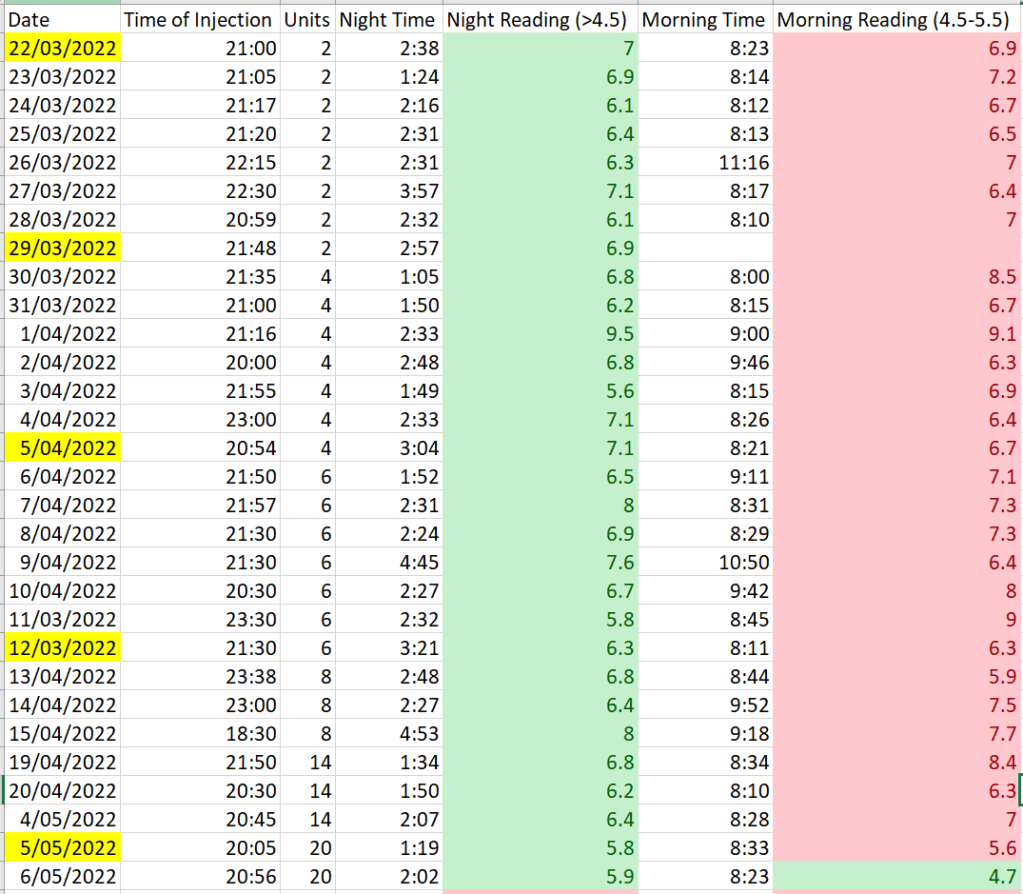
From diagnosis back in 2017 until September 2021, my HbA1c had always been less than 6.0%. Then in September my bloods came back with 6.1%. Considering that it could be due to the error margin I waited until my next appointment six months later to see the results. Unfortunately, my HbA1c in March was 6.6%. It seemed my pancreas was finally on the way out. Given I had set the line as not going over an HbA1c of 7.0% if I could avoid it, it was time to move to insulin. Discussing my glucose data with my endo we agreed that night-time was the area for immediate improvement and I moved to injecting long acting insulin before bed.
Three months on my HbA1c was 6.8% so night-time insulin was not enough an it was time to become fully insulin dependent., which I did starting with Multiple Daily Injections (MDI).
June 2022-July 2022: Injecting is not for Everyone
It turns out MDI was not for me or, at least, it was a skill which I was struggling to master. Using a flash glucose monitor, it was clear my injecting was doing little to stop mealtime spikes and Sugar Surfing with small boluses along the way was very inconvenient when using a pen injector, what with the changing of needle every time. I now understand why some people with diabetes do not swap out their needles with every injection, as is recommended. While I was intending to finally loop, even if I just moved to a pump I could more easily handle the spikes through mini-boluses at the press of a button and tracking my insulin on board should also be simpler.
At the same time, Insulet began offering half-price deals on their Omnipod wearable pumps (in Australia, Omnipod is completely unsubsidized via the public system or through private health insurance so this was compelling). I knew Omnipod was loop compatible so I jumped on board.
Concerns with Looping
Going from needles to a pump can be a big change given it comes with a loss of direct control; a machine is now putting insulin in the body, not your hand. This means there also has to be complete trust in the device not to fail. While national bodies such as the FDA in the US, and the TGA here in Australia set strong standards to ensure safety, as a LADA I have an advantage because I am still producing some insulin (in fact, my fasting c-peptide was tested in July and still sits in the normal range). A complete pump failure, for example, is unlikely to result in DKA and a trip to the hospital for me.
The looping algorithm also needs to be trusted. In the case of AndroidAPS, the documentation clearly sets out the algorithms used. The original algorithm was oref0, followed later by oref1. They are explained in detail here. Anyone concerned about the safety of OpenAPS and its derivatives, such as AndroidAPS, should read this. As a novice pumper, even if I did not quite understand everything in the oref0 and oref1 documentation, it was crystal clear the algorithms had been designed with safety as the first priority. Combined with the multiple studies on the efficacy and safety of the OpenAPS system, I was confident, as long as I took things slowly, everything was going to be fine.
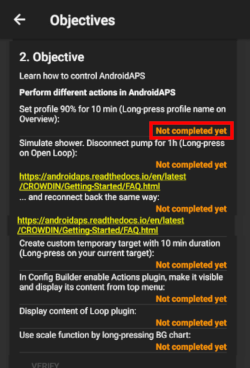
In fact, AndroidAPS forces you to take things slowly through the Objectives in the app. You are literally unable to activate features such as looping until you have completed the designated tasks and shown a level of proficiency with the application.
It should also be noted that, unlike some commercial systems, OpenAPS/AndroidAPS has no machine learning/AI component. The reason I mention this is AI systems effectively generate their own algorithm without transparency so it is impossible to know precisely why an AI system performs a specific action.
The final concern I had, unique to LADAs, was the fact that I am still producing some insulin. The OpenAPS system was, arguably, built for classic Type 1s as an artificial pancreas, not as a supplementary pancreas. Speaking with one of the great minds behind OpenAPS, Dana Lewis, via Twitter, I raised this concern. Her response was:
“It doesn’t assume anything about insulin production. It takes your input settings (basal rates, ISF, carb ratio, etc) and uses that to assess whether you appear to need more or less insulin based on BG, trend etc.”
Considering the Issue of Endogenous Insulin Production in the Context of Looping
Let us look at the settings for a typical pump which relate to insulin delivery:
- Basal Rate (how much insulin to trickle into the body to keep the liver from flooding the blood with glucose, fatty acids, and ketones)
- Insulin Sensitivity Factor (how strongly the body responds to insulin for lowering blood glucose levels)
- Insulin/Carbohydrate Ratio (how much insulin is needed to offset a specific amount of carbohydrate)
Let us also assume a hypothetical situation similar to my own where the body can produce enough insulin to cover the basal requirements for most of the day with perhaps a little extra insulin available, if needed.
The basal rate will simply be the additional insulin needed throughout the day. For my hypothetical this means much less (if any) in the day and more at night. No problems here.
Similarly, the insulin sensitivity factor should be largely unaffected by endogenous production when blood levels are stable. If I pump in a unit of insulin, it should have the same effect on my blood glucose level regardless of what my pancreas is doing.
The final parameter though, the Insulin/Carbohydrate Ratio, is affected by endogenous production. We can see this in the situation where the person eats a low carb snack. If the snack is eaten during the day, the pancreas can likely cover the snack without the need for pump insulin but, if I tell the pump what I have eaten, no matter how small, it will recommend a bolus. I cannot set a daytime ratio of infinity i.e. no insulin required, because if I eat a meal which has too many carbs for my pancreas to handle I will need insulin. What is missing is an offset value. So rather than using the formula:
Insulin required = (Carbohydrates consumed) / (Insulin/Carb Ratio)
it might be
Insulin required = (Carbohydrates consumed) / (Insulin/Carb Ratio) – maximum amount of insulin the pancreas can deliver above the basal rate
Let us consider an example to demonstrate what I am saying. If I eat an apple (10g of net carbohydrates) and my ratio is 5 then, according to my pump’s bolus wizard I will need 2 units of insulin (10/5) but, if my body can produce that additional 2 units, the pump does not need to do anything. However, if I eat a meal with 60g of net carbohydrate, the requirement will be for 12 units of which the pump will need to give me 10 on top of the 2 my body can produce.
The formula goes from I = C / 5 to I = -2 + C / 5.
How This is Resolved in Looping
So is there a flaw in oref0 or oref1 which puts LADAs in harms way? It has taken me this blog article to realise it but the answer is “no” and Dana is completely right. While blindly declaring carbs to a pump and bolusing will be inaccurate for low carb snacks, this is not how OpenAPS and AndroidAPS work. The very short version is they only give you insulin when the carbohydrates are seen in the blood, not when you declare them. Therefore, in the case of the apple, the loop will do nothing because the blood glucose levels do not change because the pancreas does its job whereas it will kick in the extra 10 units for the meal because there is a reaction in the blood due to the pancreas not being able to keep up.
Based on this difference between blind bolusing and reactive looping, it could be argued that OpenAPS looping is actually safer than manual management because there is a hypo risk in blind bolusing when eating low carb snacks which looping removes.
tl;dr
If you are a LADA considering looping, I recommend it without hesitation. In the case of AndroidAPS, the system guides you at a pace which allows you to understand what is happening as you go and, even though you may still be producing some amount of insulin, the looping system will accommodate this unlike the bolus wizard calculators of most insulin pumps on the market. The OpenAPS system is transparent in its approach and well worth considering if you have the means.